This article compares CHAIN and HBAR, analyzing their investment potential through historical price trends, supply mechanisms, institutional adoption, and technical development. It discusses their price predictions, investment strategies, and potential risks. Geared towards investors, the piece addresses critical decision factors like market stability and technological positions. CHAIN's DeFi focus contrasts with HBAR's enterprise adoption. Key terms are optimized for quick scanning, offering valuable insights for both new and seasoned investors, emphasizing HBAR's institutional traction and CHAIN's deflationary model.
Introduction: CHAIN vs HBAR Investment Comparison
In the cryptocurrency market, the comparison between CHAIN vs HBAR has been an unavoidable topic for investors. The two not only show significant differences in market cap ranking, application scenarios, and price performance but also represent different positioning in the crypto asset space.
Chain Games (CHAIN): Since its launch, it has gained market recognition for its focus on building a decentralized gaming ecosystem.
Hedera (HBAR): Since its inception, it has been hailed as a fast, secure, and fair public ledger network, using a hashgraph consensus mechanism.
This article will provide a comprehensive analysis of the investment value comparison between CHAIN and HBAR, focusing on historical price trends, supply mechanisms, institutional adoption, technological ecosystems, and future predictions, attempting to answer the question investors care about most:
"Which is the better buy right now?"
I. Price History Comparison and Current Market Status
CHAIN and HBAR Historical Price Trends
- 2023: CHAIN reached its all-time low of $0.0055509 on October 16, 2023.
- 2021: HBAR hit its all-time high of $0.569229 on September 15, 2021.
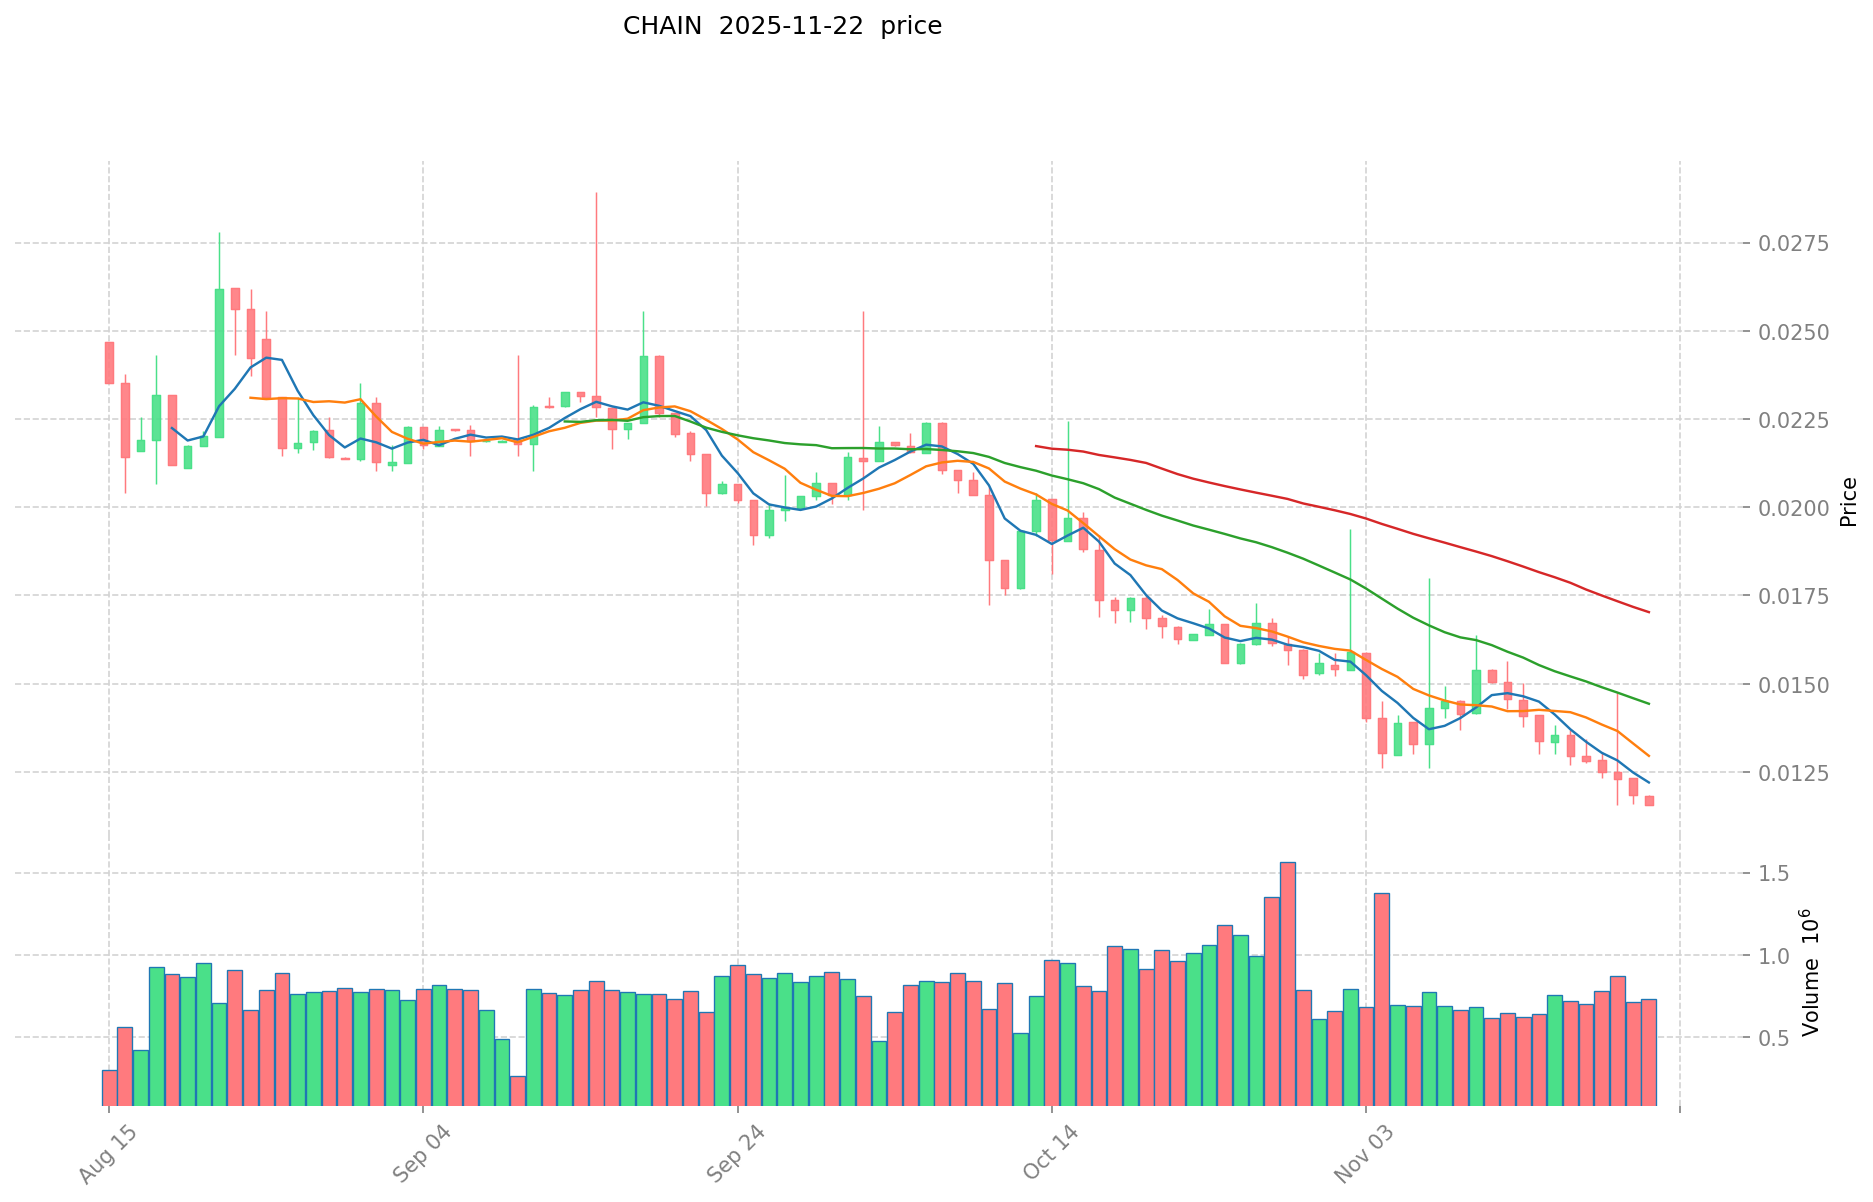
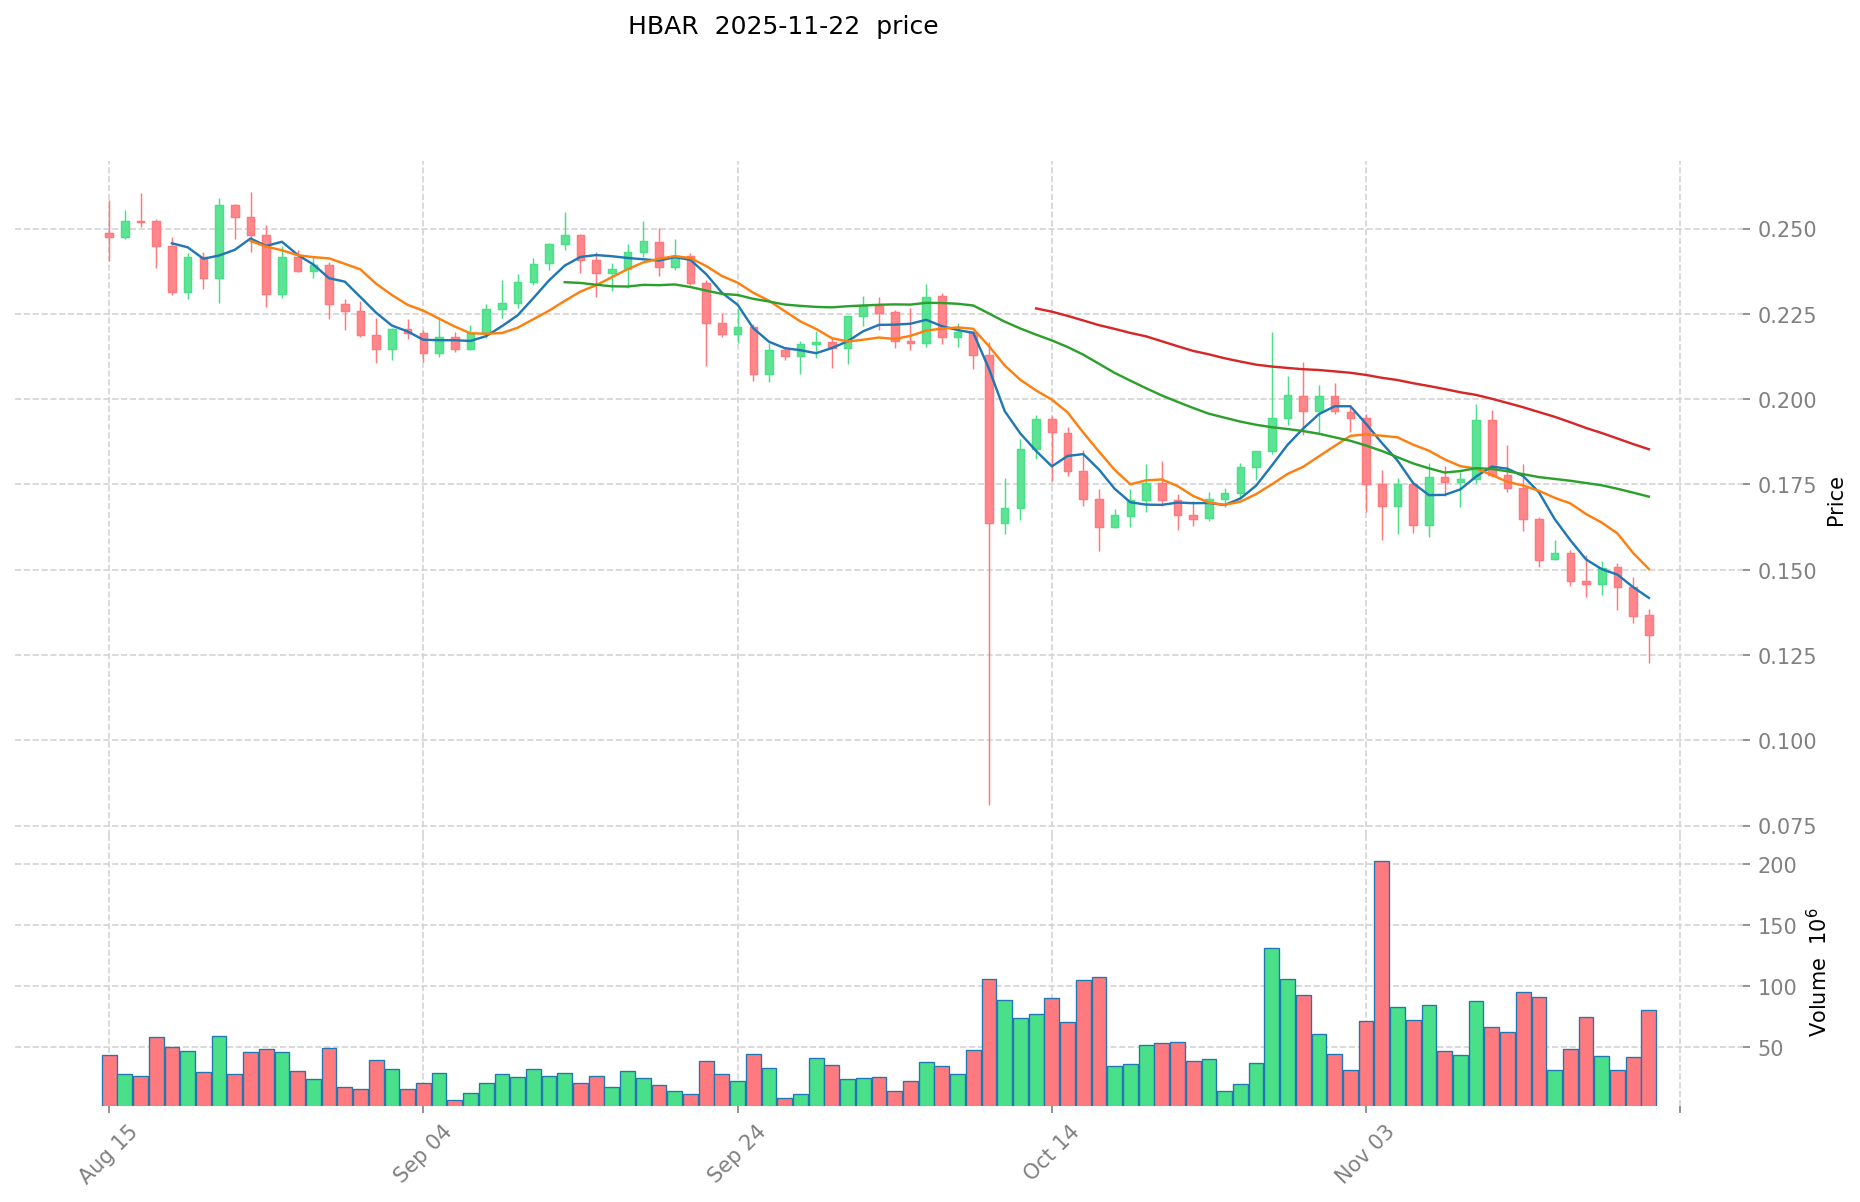
- Comparative analysis: CHAIN has experienced a significant price decline from its all-time high of $1.03 in March 2021 to its current price of $0.011689, while HBAR has shown more stability, currently trading at $0.13034.
Current Market Situation (2025-11-23)
- CHAIN current price: $0.011689
- HBAR current price: $0.13034
- 24-hour trading volume: CHAIN $10,303.33 vs HBAR $3,540,214.36
- Market Sentiment Index (Fear & Greed Index): 11 (Extreme Fear)
Click to view real-time prices:
- View CHAIN current price Market Price
- View HBAR current price Market Price
II. Core Factors Affecting Investment Value of CHAIN vs HBAR
Supply Mechanisms Comparison (Tokenomics)
- CHAIN: The token employs a deflationary mechanism through transaction burn, with a maximum supply of 11.2 billion tokens. Approximately 30% of all transaction fees are burned.
- HBAR: Total supply capped at 50 billion tokens with a gradual release schedule extending over many years. The network employs a proof-of-stake consensus mechanism that requires significantly less energy than traditional proof-of-work systems.
- 📌 Historical Pattern: Deflationary mechanisms like CHAIN's tend to create upward price pressure over time, while HBAR's controlled release aims to maintain price stability while ecosystem adoption grows.
Institutional Adoption and Market Applications
- Institutional Holdings: HBAR has gained more institutional traction with backing from major organizations on its governing council, including Google, IBM, Boeing, and LG.
- Enterprise Adoption: HBAR has stronger enterprise integration through Hedera's council structure, focusing on real-world applications in supply chain, finance, and healthcare. CHAIN has developed growing enterprise applications primarily in the DeFi and cross-chain transaction spaces.
- Regulatory Attitudes: Both networks have worked toward regulatory compliance, with HBAR potentially having an advantage due to its governance structure involving established enterprises that regularly work within regulatory frameworks.
Technical Development and Ecosystem Building
- CHAIN Technical Upgrades: Implementation of cross-chain capabilities and integration with major blockchains. The network prioritizes interoperability solutions.
- HBAR Technical Development: Focus on enterprise-grade infrastructure with continued optimization of the hashgraph consensus algorithm. Recent development includes staking capabilities and smart contract functionality improvements.
- Ecosystem Comparison: CHAIN has stronger positioning in DeFi applications and cross-chain solutions, while HBAR shows greater strength in enterprise applications and supply chain solutions. Both are developing NFT capabilities, with HBAR focusing on carbon-negative NFTs and enterprise applications.
Macroeconomic Factors and Market Cycles
- Inflation Performance: HBAR's enterprise backing and utility-focused approach may provide stability during inflationary periods, while CHAIN's deflationary mechanism could theoretically provide inflation resistance.
- Monetary Policy Impact: Both tokens face similar challenges from interest rate fluctuations and dollar strength, though HBAR's enterprise integration may provide more insulation from market volatility.
- Geopolitical Factors: HBAR's corporate governance model provides stability but potential centralization concerns, while CHAIN's focus on cross-chain operations positions it well for fragmented global markets.
III. 2025-2030 Price Prediction: CHAIN vs HBAR
Short-term Prediction (2025)
- CHAIN: Conservative $0.00788188 - $0.011591 | Optimistic $0.011591 - $0.01541603
- HBAR: Conservative $0.1194344 - $0.12982 | Optimistic $0.12982 - $0.1778534
Mid-term Prediction (2027)
- CHAIN may enter a growth phase, with prices expected in the range of $0.0086490013575 - $0.0151711991025
- HBAR may enter a bullish market, with prices expected in the range of $0.14472956736 - $0.22054029312
- Key drivers: Institutional capital inflow, ETF developments, ecosystem growth
Long-term Prediction (2030)
- CHAIN: Base scenario $0.015834742511133 - $0.017026604850681 | Optimistic scenario $0.017026604850681 - $0.01924006348127
- HBAR: Base scenario $0.238429220854759 - $0.25637550629544 | Optimistic scenario $0.25637550629544 - $0.3204693828693
View detailed price predictions for CHAIN and HBAR
Disclaimer: This analysis is based on historical data and market projections. Cryptocurrency markets are highly volatile and unpredictable. This information should not be considered as financial advice. Always conduct your own research before making investment decisions.
CHAIN:
| 年份 |
预测最高价 |
预测平均价格 |
预测最低价 |
涨跌幅 |
| 2025 |
0.01541603 |
0.011591 |
0.00788188 |
0 |
| 2026 |
0.0148538665 |
0.013503515 |
0.01174805805 |
15 |
| 2027 |
0.0151711991025 |
0.01417869075 |
0.0086490013575 |
21 |
| 2028 |
0.016142439418875 |
0.01467494492625 |
0.011006208694687 |
25 |
| 2029 |
0.0186445175288 |
0.015408692172562 |
0.013405562190129 |
31 |
| 2030 |
0.01924006348127 |
0.017026604850681 |
0.015834742511133 |
45 |
HBAR:
| 年份 |
预测最高价 |
预测平均价格 |
预测最低价 |
涨跌幅 |
| 2025 |
0.1778534 |
0.12982 |
0.1194344 |
0 |
| 2026 |
0.190757508 |
0.1538367 |
0.119992626 |
18 |
| 2027 |
0.22054029312 |
0.172297104 |
0.14472956736 |
32 |
| 2028 |
0.2494517471712 |
0.19641869856 |
0.1748126417184 |
50 |
| 2029 |
0.28981578972528 |
0.2229352228656 |
0.214017813950976 |
71 |
| 2030 |
0.3204693828693 |
0.25637550629544 |
0.238429220854759 |
96 |
IV. Investment Strategy Comparison: CHAIN vs HBAR
Long-term vs Short-term Investment Strategy
- CHAIN: Suitable for investors focused on DeFi and cross-chain potential
- HBAR: Suitable for investors seeking enterprise adoption and stability
Risk Management and Asset Allocation
- Conservative investors: CHAIN: 20% vs HBAR: 80%
- Aggressive investors: CHAIN: 40% vs HBAR: 60%
- Hedging tools: Stablecoin allocation, options, cross-currency portfolio
V. Potential Risk Comparison
Market Risk
- CHAIN: Higher volatility due to smaller market cap and lower liquidity
- HBAR: Potential market saturation in enterprise blockchain solutions
Technical Risk
- CHAIN: Scalability, network stability
- HBAR: Centralization concerns, potential vulnerabilities in hashgraph consensus
Regulatory Risk
- Global regulatory policies may impact HBAR more due to its enterprise focus, while CHAIN may face scrutiny in DeFi regulations
VI. Conclusion: Which Is the Better Buy?
📌 Investment Value Summary:
- CHAIN advantages: Deflationary mechanism, strong position in DeFi and cross-chain solutions
- HBAR advantages: Institutional backing, enterprise adoption, stable governance structure
✅ Investment Advice:
- New investors: Consider a higher allocation to HBAR for its stability and institutional backing
- Experienced investors: Balanced approach with both tokens, leveraging CHAIN's DeFi potential and HBAR's enterprise solutions
- Institutional investors: Focus on HBAR for its enterprise-grade infrastructure and corporate governance model
⚠️ Risk Warning: Cryptocurrency markets are highly volatile. This article does not constitute investment advice.
None
VII. FAQ
Q1: What are the main differences between CHAIN and HBAR?
A: CHAIN focuses on building a decentralized gaming ecosystem and has a strong position in DeFi and cross-chain solutions. HBAR is positioned as a fast, secure public ledger network with a hashgraph consensus mechanism and has significant enterprise adoption.
Q2: Which token has shown better price stability?
A: HBAR has shown more price stability compared to CHAIN. While CHAIN has experienced significant price decline from its all-time high, HBAR has maintained a more stable trading range.
Q3: How do the supply mechanisms of CHAIN and HBAR differ?
A: CHAIN employs a deflationary mechanism through transaction burn, with a maximum supply of 11.2 billion tokens. HBAR has a total supply capped at 50 billion tokens with a gradual release schedule over many years.
Q4: Which token has stronger institutional adoption?
A: HBAR has gained more institutional traction with backing from major organizations on its governing council, including Google, IBM, Boeing, and LG.
Q5: What are the key technical developments for each token?
A: CHAIN has implemented cross-chain capabilities and integration with major blockchains. HBAR focuses on enterprise-grade infrastructure with continued optimization of the hashgraph consensus algorithm, including recent developments in staking capabilities and smart contract functionality.
Q6: How do the long-term price predictions for CHAIN and HBAR compare?
A: By 2030, CHAIN's base scenario price range is predicted to be $0.015834742511133 - $0.017026604850681, while HBAR's base scenario range is $0.238429220854759 - $0.25637550629544.
Q7: What investment strategies are recommended for CHAIN and HBAR?
A: For conservative investors, a 20% CHAIN to 80% HBAR allocation is suggested. For aggressive investors, a 40% CHAIN to 60% HBAR ratio is recommended. New investors might consider a higher allocation to HBAR for its stability, while experienced investors could take a balanced approach with both tokens.
* The information is not intended to be and does not constitute financial advice or any other recommendation of any sort offered or endorsed by Gate.