Crypto心诚
Web3投資人 | Crypto實戰交易員
BTC/ETH定投分享 | 市場分析+打野機會
每周實戰干貨|幫你避坑賺機會
Crypto心诚
7🈷25日 $BTC 综合行情分析
😇消息面:
地缘与宏观:美伊冲突持续升级,布伦特原油升至约$97.66/桶,但比特币展现韧性,未像以往油价飙升时那样大幅受挫。传统市场平淡,黄金守住$4,000上方
监管:CLARITY Act仍陷僵局,市场缺乏明确催化剂
其他:Strategy调整比特币相关指标;大型矿池Poolin申请破产;期权市场出现约$50亿规模的看涨集群。整体情绪偏谨慎,但机构与衍生品定位显示一定底部支撑预期。
😇资金面:
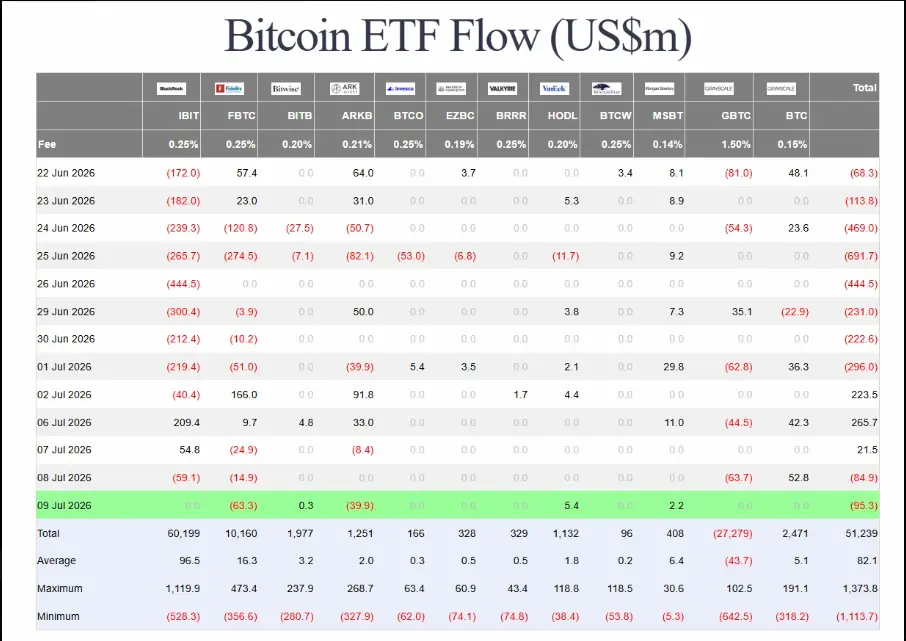
现货比特币ETF:7月24日录得小幅净流出约**-$27.9M**(前一日7月23日为较大流出-$225.1M)。近期从多日净流入转为温和流出,反映获利了结与周末前谨慎情绪。总净资产仍维持在较高水平
链上/机构:7月整体鲸鱼仍有显著积累(近两周约27万枚BTC),企业持仓增加趋势延续。衍生品未平仓量稳定,看涨期权偏向明显
资金面从“流入支撑反弹”转为小幅流出+整理,短期压力有限但缺乏新资金推动突破
😇技术面:
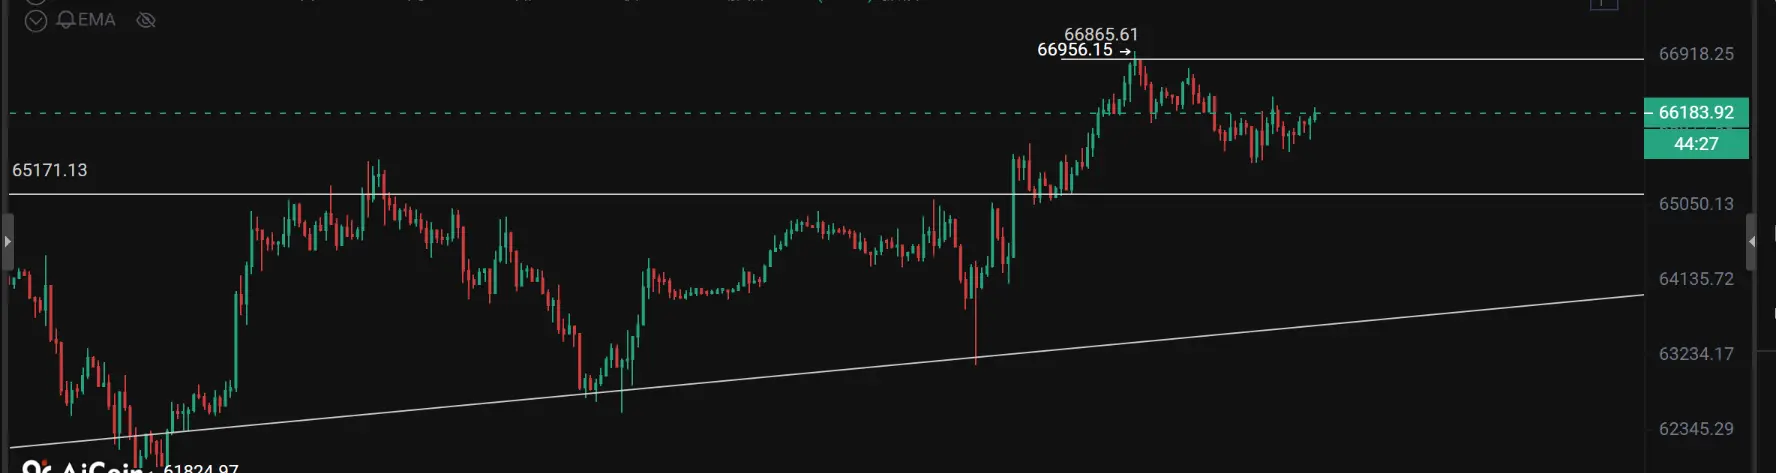
大家周末好呀,周末维持着震荡为主,现在来到了多空临界点,已经回踩到了上升趋势线,从目前来看4h已经跌破0轴,所以这个位置跌破的概率比较大,跌破的话下方支撑在62500附近,所以总结来看日内以震荡和震荡下行为主
支撑:63800-62500
阻力:64500-65500
😇消息面:
地缘与宏观:美伊冲突持续升级,布伦特原油升至约$97.66/桶,但比特币展现韧性,未像以往油价飙升时那样大幅受挫。传统市场平淡,黄金守住$4,000上方
监管:CLARITY Act仍陷僵局,市场缺乏明确催化剂
其他:Strategy调整比特币相关指标;大型矿池Poolin申请破产;期权市场出现约$50亿规模的看涨集群。整体情绪偏谨慎,但机构与衍生品定位显示一定底部支撑预期。
😇资金面:
现货比特币ETF:7月24日录得小幅净流出约**-$27.9M**(前一日7月23日为较大流出-$225.1M)。近期从多日净流入转为温和流出,反映获利了结与周末前谨慎情绪。总净资产仍维持在较高水平
链上/机构:7月整体鲸鱼仍有显著积累(近两周约27万枚BTC),企业持仓增加趋势延续。衍生品未平仓量稳定,看涨期权偏向明显
资金面从“流入支撑反弹”转为小幅流出+整理,短期压力有限但缺乏新资金推动突破
😇技术面:
大家周末好呀,周末维持着震荡为主,现在来到了多空临界点,已经回踩到了上升趋势线,从目前来看4h已经跌破0轴,所以这个位置跌破的概率比较大,跌破的话下方支撑在62500附近,所以总结来看日内以震荡和震荡下行为主
支撑:63800-62500
阻力:64500-65500
- 打賞
- 按讚
- 回覆
- 轉發
- 分享
7月24日 综合行情分析
😇消息面:
监管进展:参议院共和党发布 CLARITY Act 最新草案,新增针对公职人员及配偶的加密伦理限制条款。市场原本期待法案赶在国会夏季休会前推进,但多消息显示可能错过窗口,下一步关键节点指向 8 月 10 日左右。高盛 CEO 公开表态支持该法案,认为有助于市场稳定,但民主党仍有异议。监管不确定性继续压制短期风险偏好
宏观环境:美股受 AI 投资担忧与地缘紧张影响承压,风险资产整体情绪偏谨慎,比特币跟随波动
链上/持有者:7 月整体鲸鱼仍净积累约 27 万枚 BTC,长期持有者供应保持高位,显示强手信心未完全动摇,但短期缺乏新催化剂
😇资金面:
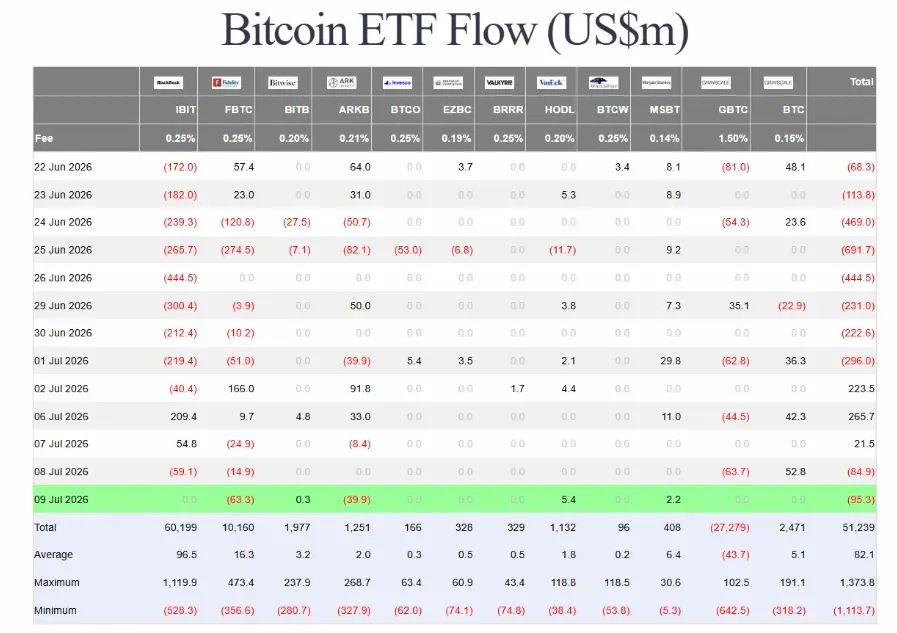
现货比特币 ETF:7 月 23 日录得净流出约 $225.1M,黑石 IBIT 领衔赎回,Fidelity 等也有流出。这结束了此前连续多日的净流入
累计 YTD 净流入仍维持在较高水平(约 +$52B 量级),但单日大幅流出反映获利了结与情绪降温
交易所储备与鲸鱼动向仍偏积累,但 ETF 资金短期转向净卖,对价格形成直接压力
😇技术面:
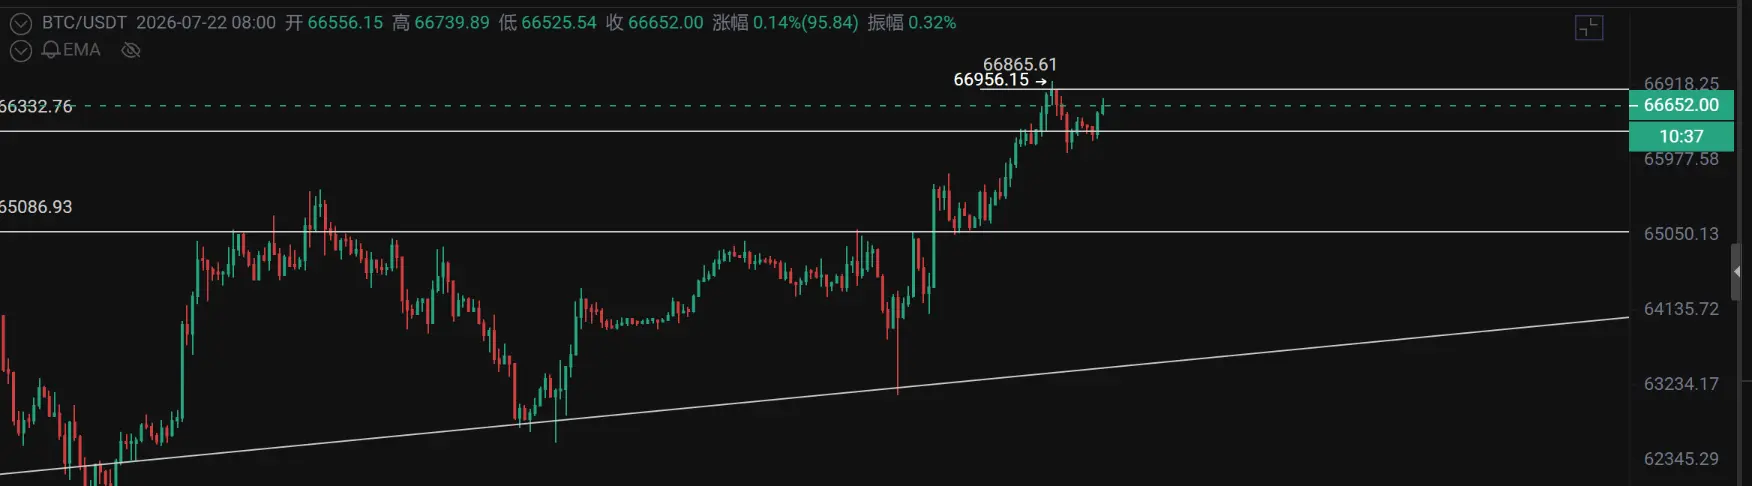
昨天跟大家提到要注意留意 4h 级别及以下的风险,那昨天进行了一波回踩,回踩到了 65000 依旧没有有效跌破
当下,日线依然以震荡上行为主,日内要关注 1h 级别的二次探底,回踩不破 64800 就会延续多头,明天周末了可能会围绕着震荡修复为主了
今年的行情真
查看原文😇消息面:
监管进展:参议院共和党发布 CLARITY Act 最新草案,新增针对公职人员及配偶的加密伦理限制条款。市场原本期待法案赶在国会夏季休会前推进,但多消息显示可能错过窗口,下一步关键节点指向 8 月 10 日左右。高盛 CEO 公开表态支持该法案,认为有助于市场稳定,但民主党仍有异议。监管不确定性继续压制短期风险偏好
宏观环境:美股受 AI 投资担忧与地缘紧张影响承压,风险资产整体情绪偏谨慎,比特币跟随波动
链上/持有者:7 月整体鲸鱼仍净积累约 27 万枚 BTC,长期持有者供应保持高位,显示强手信心未完全动摇,但短期缺乏新催化剂
😇资金面:
现货比特币 ETF:7 月 23 日录得净流出约 $225.1M,黑石 IBIT 领衔赎回,Fidelity 等也有流出。这结束了此前连续多日的净流入
累计 YTD 净流入仍维持在较高水平(约 +$52B 量级),但单日大幅流出反映获利了结与情绪降温
交易所储备与鲸鱼动向仍偏积累,但 ETF 资金短期转向净卖,对价格形成直接压力
😇技术面:
昨天跟大家提到要注意留意 4h 级别及以下的风险,那昨天进行了一波回踩,回踩到了 65000 依旧没有有效跌破
当下,日线依然以震荡上行为主,日内要关注 1h 级别的二次探底,回踩不破 64800 就会延续多头,明天周末了可能会围绕着震荡修复为主了
今年的行情真
- 打賞
- 按讚
- 回覆
- 轉發
- 分享
7🈷23日 $BTC 综合行情分析
😇消息面:
最核心利好来自美国监管进展: CLARITY Act取得实质性突破:白宫与参议院就伦理条款(禁止总统、副总统及高官在任期内从加密中获利)达成协议,显著提升法案在8月休会前通过的可能性。这直接提振了机构和市场信心,相关加密股票盘中大涨。
宏观环境偏暖:美国就业数据偏软 + 美联储官员关于AI提升生产力可缓解通胀的表态,强化了2026年降息预期,利好风险资产
美伊地缘紧张持续推升油价,带来一定通胀担忧,但整体风险偏好仍因政策乐观而改善,并未显著压制比特币
😇资金面:
美国现货比特币ETF连续6天净流入,累计超$900百万 (部分数据达$930M),这是自5月以来最长正流入周期。7月20-21日单日流入曾达$226M-$203M左右,黑石IBIT、富达FBTC等为主力
交易所大额流出(单日曾达数亿美元级别),减少了潜在卖压
长期持有者净持仓变化转为积极,鲸鱼/大户停止抛售并有积累迹象,显示“聪明钱”信心回升
😇技术面:
昨天给大家的支撑位回踩后就进行了反弹,日线的多头还没走完,日内关注四小时级别的反抽是否能站稳66800,如果站不稳要注意回调的风险
所以总结来看关注一小时级别的反弹力度和临界点,日内小级别以反弹为主,留意小级别是否能带动大级别
支撑:65800-65200 阻力:66
- 打賞
- 按讚
- 回覆
- 轉發
- 分享
7🈷22日 $BTC 綜合行情分析
😇 消息面:
積極催化劑:美國現貨比特幣 ETF 連續第 5 個交易日淨流入,7 月 20 日單日流入約**$227 百萬**(自 7 月 6 日以來最高),5 天累計約**$727 百萬**。BlackRock 的 IBIT 是主要貢獻者
Strategy(前 MicroStrategy)雖然披露出售部分 MSTR 股份用於美元儲備(而非常規買 BTC),但市場反應有限,BTC 仍強勢上漲,顯示投資者對長期持有邏輯的信心未受明顯動搖。
其他利好:Galaxy 推出比特幣量子運算準備倡議(承諾最高 $500 萬開發者資助);Coinbase 支持比特幣期貨交叉保證金和迷你合約交易。這些機構級動作強化了比特幣作為「數位黃金」和基礎設施資產的敘事
宏觀背景:中東緊張局勢再起,但風險資產(包括 BTC 和美股)仍能維持韌性,顯示市場對地緣風險的定價較為克制。
😇 資金面:
ETF 流入強勁:連續多日正流入打破了此前長時間淨流出趨勢,顯示機構資金正在逐步回流。過去一週或更長時間的流入數據支持反彈的可持續性
槓桿清算:過去 24 小時加密市場強制平倉約 $242 百萬,其中空頭占 $182.5 百萬,這直接為價格上漲提供了燃料
鏈上與持倉:部分比特幣仍處於浮虧狀態(約一半供應 underwater),但「聰明錢」有積累跡象。Strategy 仍持有
查看原文😇 消息面:
積極催化劑:美國現貨比特幣 ETF 連續第 5 個交易日淨流入,7 月 20 日單日流入約**$227 百萬**(自 7 月 6 日以來最高),5 天累計約**$727 百萬**。BlackRock 的 IBIT 是主要貢獻者
Strategy(前 MicroStrategy)雖然披露出售部分 MSTR 股份用於美元儲備(而非常規買 BTC),但市場反應有限,BTC 仍強勢上漲,顯示投資者對長期持有邏輯的信心未受明顯動搖。
其他利好:Galaxy 推出比特幣量子運算準備倡議(承諾最高 $500 萬開發者資助);Coinbase 支持比特幣期貨交叉保證金和迷你合約交易。這些機構級動作強化了比特幣作為「數位黃金」和基礎設施資產的敘事
宏觀背景:中東緊張局勢再起,但風險資產(包括 BTC 和美股)仍能維持韌性,顯示市場對地緣風險的定價較為克制。
😇 資金面:
ETF 流入強勁:連續多日正流入打破了此前長時間淨流出趨勢,顯示機構資金正在逐步回流。過去一週或更長時間的流入數據支持反彈的可持續性
槓桿清算:過去 24 小時加密市場強制平倉約 $242 百萬,其中空頭占 $182.5 百萬,這直接為價格上漲提供了燃料
鏈上與持倉:部分比特幣仍處於浮虧狀態(約一半供應 underwater),但「聰明錢」有積累跡象。Strategy 仍持有
- 打賞
- 按讚
- 回覆
- 轉發
- 分享
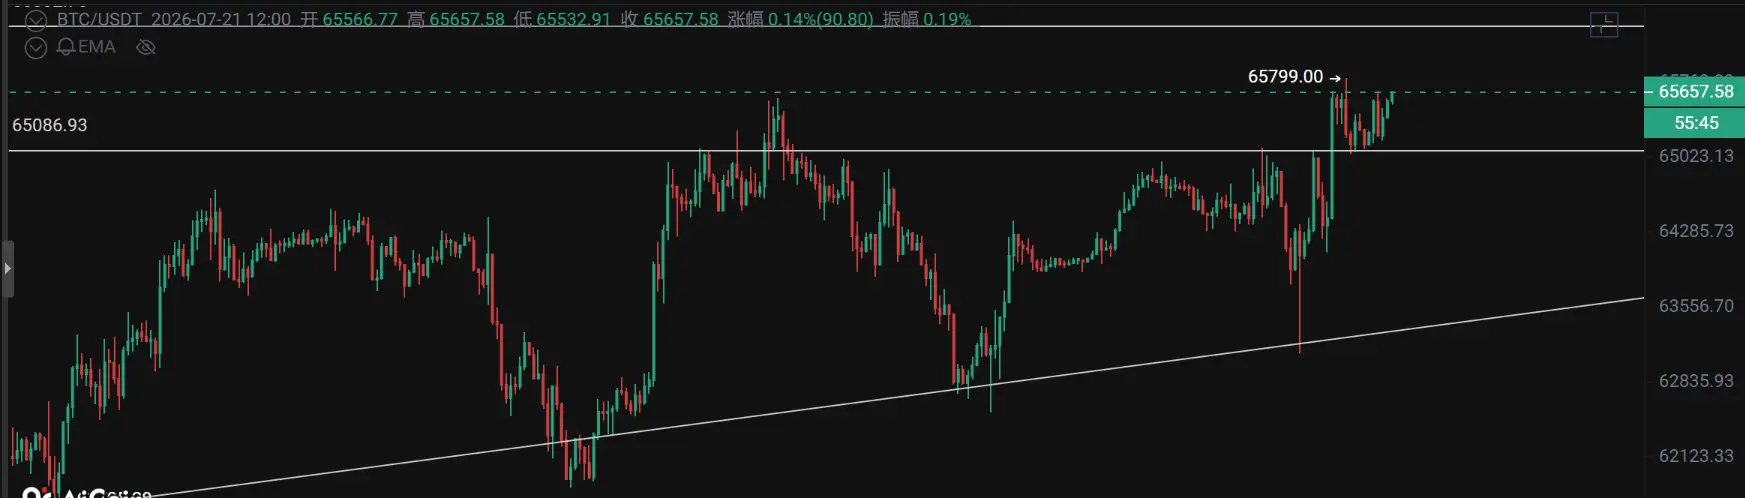
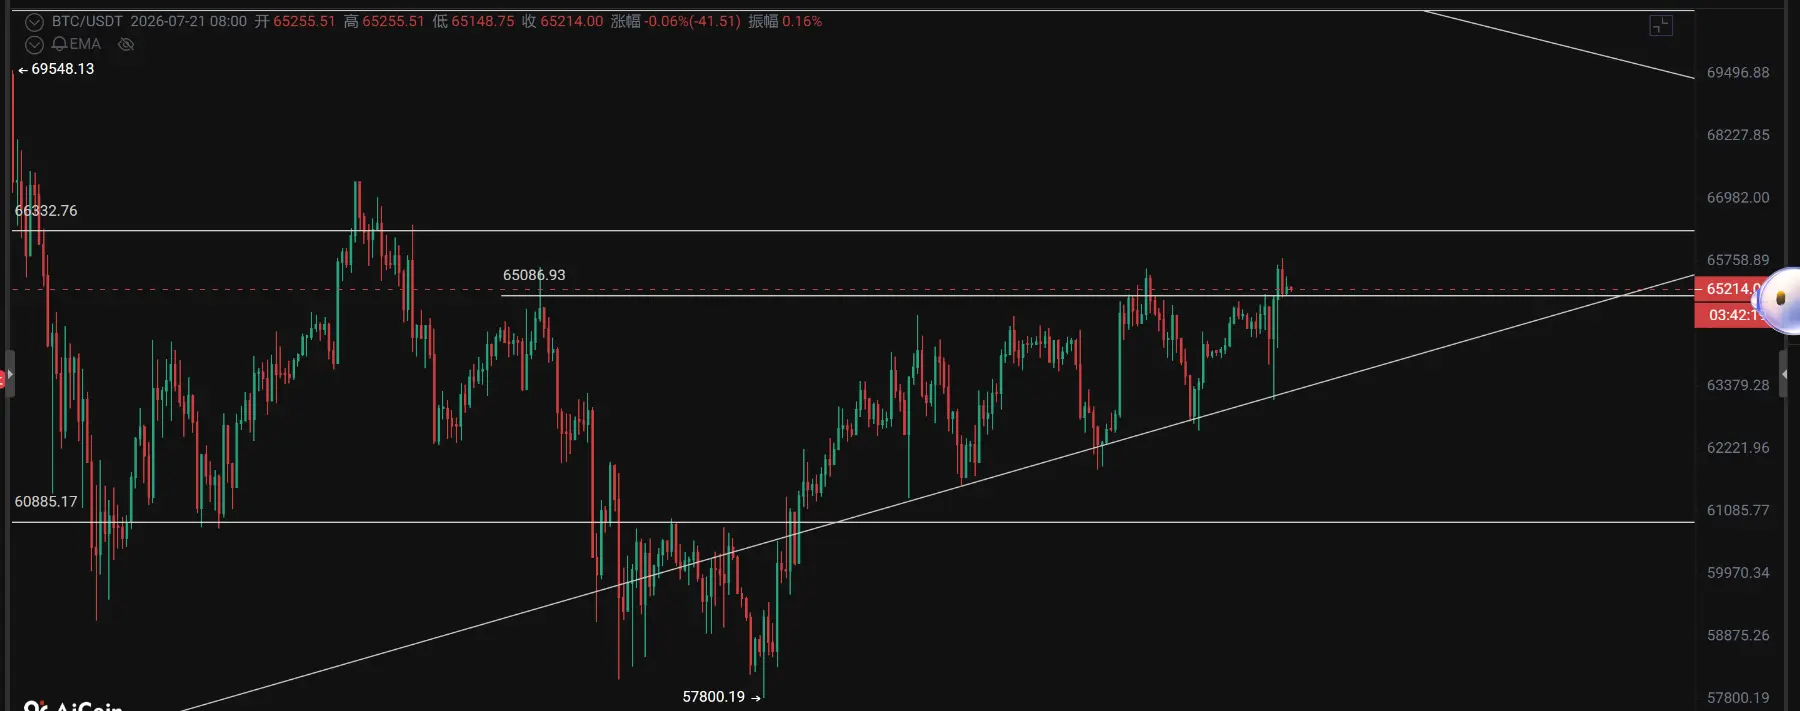
7🈷️21日 $BTC 综合行情分析
🤯消息面:
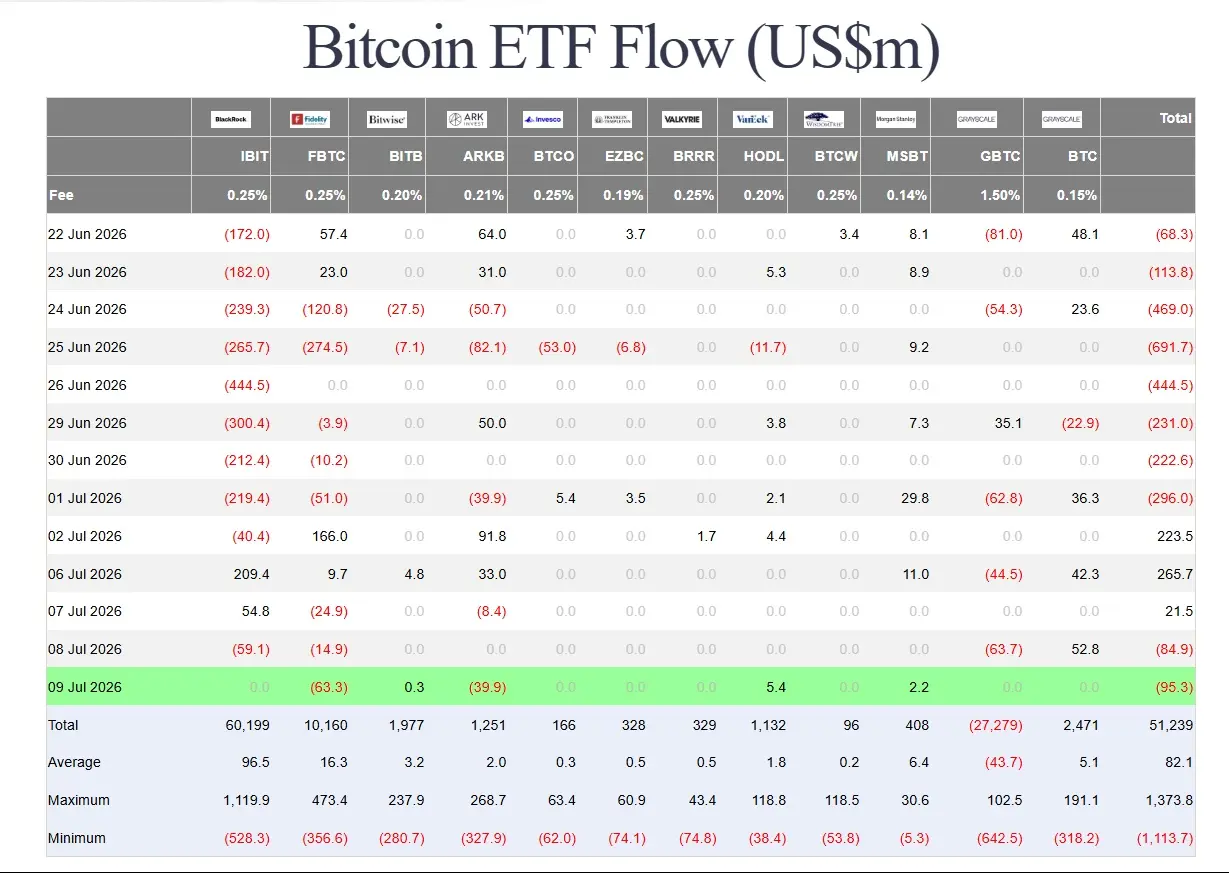
正面因素:比特币从近期低点反弹,重新站上$65,000附近。ETF资金流入恢复(上周净流入约$197M-$273M,结束此前数周大规模流出),BlackRock等机构产品有显著净流入。微策略等公司继续持有/积累BTC,提供机构需求支撑。地缘政治未造成持久崩盘,显示市场韧性
负面/谨慎因素:Fear & Greed指数降至29(极度恐惧),反映市场情绪低迷。Strategy授权潜在BTC销售(最高$12.5亿),虽未立即冲击价格,但增加供给压力。宏观上,美股科技股抛售和风险厌恶情绪有所拖累。
🤯资金面:
ETF流入回暖:7月上旬转为净流入(单日最高超$200M),部分抵消6月创纪录流出(超$8B)。这为价格提供支撑,尤其BlackRock IBIT等主导
链上数据:交易所净流出(卖压减轻),长期持有者(LTH)占比高并继续积累。鲸鱼活动相对稳定,但短期持有者仍有部分获利/止损。杠杆有所冷却,减少爆仓风险。
🤯技术面:
昨天的盘面分析就跟大家所提到要去留意市场的反弹,那我们看到当下的盘面,比特币已经突破了昨天我们所提到的65K的关口,并且突破了三角位的上沿,紧接着日内要去关注它是否能够去延续,所以总结来看,日内只要不破65K,它就会围绕着66.5K去走,那66.5K是这一波的多空分水岭,只要这个位置能够去站稳,就会围绕着68K到
🤯消息面:
正面因素:比特币从近期低点反弹,重新站上$65,000附近。ETF资金流入恢复(上周净流入约$197M-$273M,结束此前数周大规模流出),BlackRock等机构产品有显著净流入。微策略等公司继续持有/积累BTC,提供机构需求支撑。地缘政治未造成持久崩盘,显示市场韧性
负面/谨慎因素:Fear & Greed指数降至29(极度恐惧),反映市场情绪低迷。Strategy授权潜在BTC销售(最高$12.5亿),虽未立即冲击价格,但增加供给压力。宏观上,美股科技股抛售和风险厌恶情绪有所拖累。
🤯资金面:
ETF流入回暖:7月上旬转为净流入(单日最高超$200M),部分抵消6月创纪录流出(超$8B)。这为价格提供支撑,尤其BlackRock IBIT等主导
链上数据:交易所净流出(卖压减轻),长期持有者(LTH)占比高并继续积累。鲸鱼活动相对稳定,但短期持有者仍有部分获利/止损。杠杆有所冷却,减少爆仓风险。
🤯技术面:
昨天的盘面分析就跟大家所提到要去留意市场的反弹,那我们看到当下的盘面,比特币已经突破了昨天我们所提到的65K的关口,并且突破了三角位的上沿,紧接着日内要去关注它是否能够去延续,所以总结来看,日内只要不破65K,它就会围绕着66.5K去走,那66.5K是这一波的多空分水岭,只要这个位置能够去站稳,就会围绕着68K到
- 打賞
- 按讚
- 回覆
- 轉發
- 分享
7🈷️20日 $BTC 綜合行情分析
🤯 消息面:
7月19日加密市場小幅反彈:比特幣上漲約0.47%,全球加密市值穩定在約1.25 萬億美元。恐懼與貪婪指數進入中性區(50/100),較此前下降但未極度恐慌
更廣泛7月背景:比特幣自6月底低點反彈近8-10%,受美國就業數據疲軟、ETF 流入回暖及季節性「Green July」預期驅動。歷史數據顯示,類似2018/2022年6月大跌後,7月常出現反彈
風險點:地緣事件(如特朗普伊朗相關評論)、Strategy等機構減持,以及美聯儲7月底會議前的觀望情緒。無重大負面突發,但宏觀不確定性仍存
🤯 資金面:
ETF Flows:7月上旬結束8週流出,出現多日正流入(單日最高200M+,週流入約197M)。BlackRock IBIT等主導,但整體仍審慎(累計仍有流出壓力)。7月19日前後數據延續小幅正向或穩定,支撐價格反彈
On-chain:部分指標顯示底部訊號(如MVRV、實現價格附近支撐),但供應仍部分「水下」(>50% 持幣虧損)。鯨魚流動和交易所流入需監控。資金利率溫和正值,槓桿未過度擁擠。
整體:機構資金回流是反彈核心,但夏季流動性偏薄,需求未出現爆發式增長
🤯 技術面:
今天早上的盤面在這裡來回穿梭,從週線級別來看,當下這個位置即將形成底背離,意味著會推動一波行情的反彈。反彈這一波的終結可能會放在7萬附近,從大的方
查看原文🤯 消息面:
7月19日加密市場小幅反彈:比特幣上漲約0.47%,全球加密市值穩定在約1.25 萬億美元。恐懼與貪婪指數進入中性區(50/100),較此前下降但未極度恐慌
更廣泛7月背景:比特幣自6月底低點反彈近8-10%,受美國就業數據疲軟、ETF 流入回暖及季節性「Green July」預期驅動。歷史數據顯示,類似2018/2022年6月大跌後,7月常出現反彈
風險點:地緣事件(如特朗普伊朗相關評論)、Strategy等機構減持,以及美聯儲7月底會議前的觀望情緒。無重大負面突發,但宏觀不確定性仍存
🤯 資金面:
ETF Flows:7月上旬結束8週流出,出現多日正流入(單日最高200M+,週流入約197M)。BlackRock IBIT等主導,但整體仍審慎(累計仍有流出壓力)。7月19日前後數據延續小幅正向或穩定,支撐價格反彈
On-chain:部分指標顯示底部訊號(如MVRV、實現價格附近支撐),但供應仍部分「水下」(>50% 持幣虧損)。鯨魚流動和交易所流入需監控。資金利率溫和正值,槓桿未過度擁擠。
整體:機構資金回流是反彈核心,但夏季流動性偏薄,需求未出現爆發式增長
🤯 技術面:
今天早上的盤面在這裡來回穿梭,從週線級別來看,當下這個位置即將形成底背離,意味著會推動一波行情的反彈。反彈這一波的終結可能會放在7萬附近,從大的方
- 打賞
- 按讚
- 回覆
- 轉發
- 分享
本週(7.20-7.26) Web3 重要事件:
7 月 20 日
長鑫科技中籤結果已出爐,投資者需於 7 月 20 日及時履行繳款義務;
Cango 將於 7 月 20 日以 10:1 比例合併股份
7 月 21 日
Zcash Ironwood 升級主網激活預計於 7 月 21 日進行
7 月 23 日
歐洲央行將於 7 月 23 日公布新一期利率決議;
Cap 第二季積分活動 Homestead 將於 7 月 23 日結束
7 月 24 日
Worldcoin 將調整 WLD 代幣經濟模型,7 月 24 日起日解鎖規模將降低 43%;
其他(具體時間未定)
美參議院擬於下週審議 CLARITY 法案,需至少 7 名民主黨參議員支持
查看原文7 月 20 日
長鑫科技中籤結果已出爐,投資者需於 7 月 20 日及時履行繳款義務;
Cango 將於 7 月 20 日以 10:1 比例合併股份
7 月 21 日
Zcash Ironwood 升級主網激活預計於 7 月 21 日進行
7 月 23 日
歐洲央行將於 7 月 23 日公布新一期利率決議;
Cap 第二季積分活動 Homestead 將於 7 月 23 日結束
7 月 24 日
Worldcoin 將調整 WLD 代幣經濟模型,7 月 24 日起日解鎖規模將降低 43%;
其他(具體時間未定)
美參議院擬於下週審議 CLARITY 法案,需至少 7 名民主黨參議員支持
- 打賞
- 按讚
- 回覆
- 轉發
- 分享
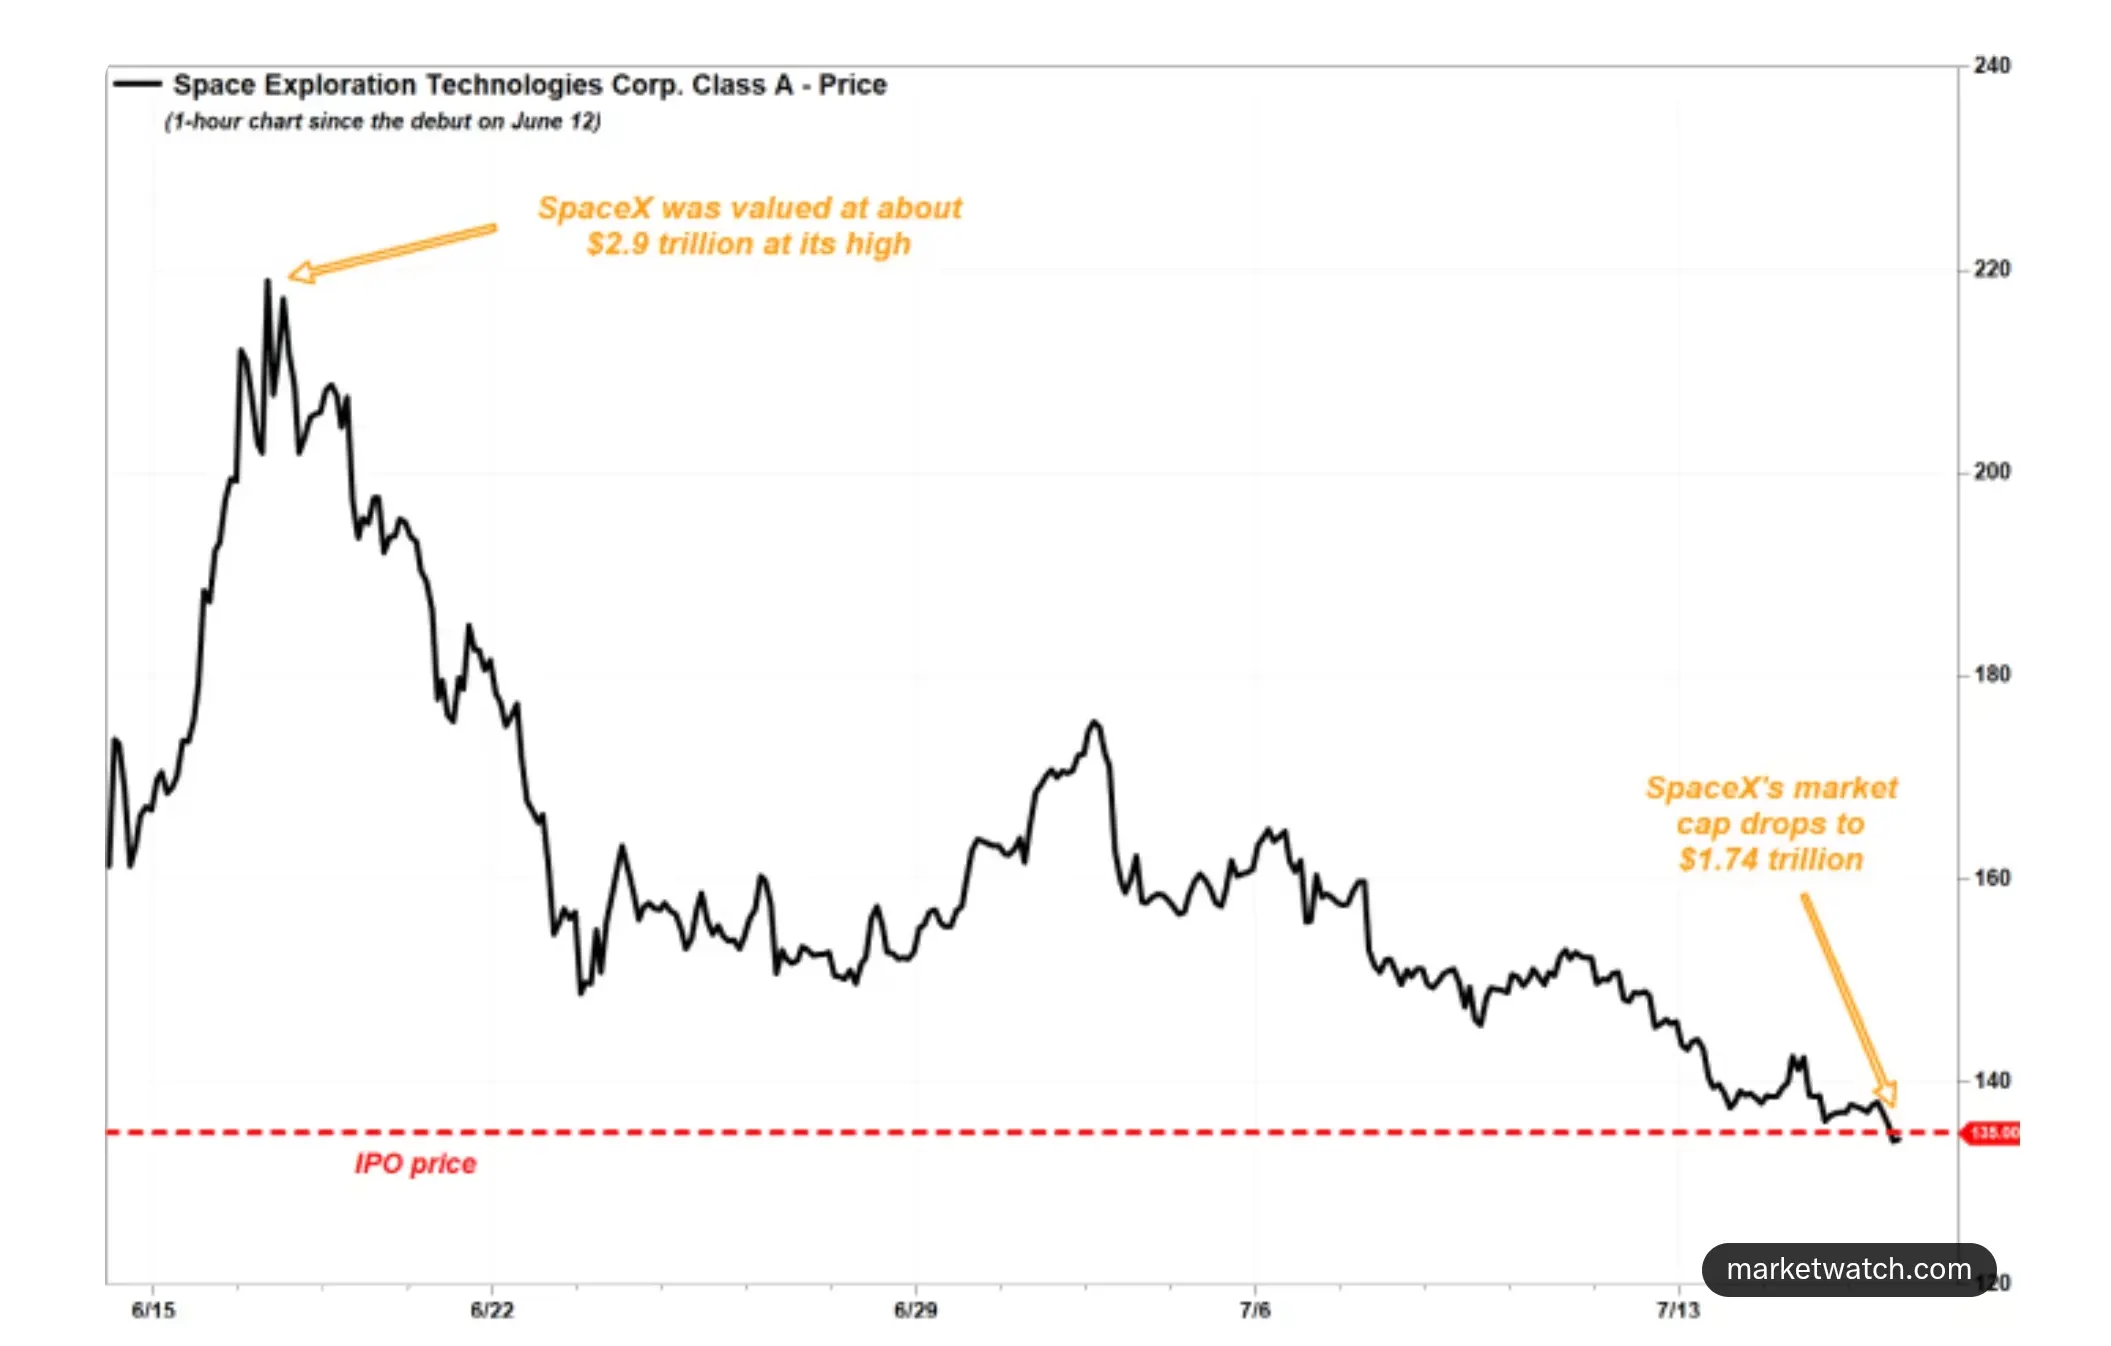
SpaceX 上市不到一個月就破發了!這波是機會還是陷阱❓
6 月 12 日,SpaceX 以 135 美元發行價完成史上最大 IPO,首周衝到 200 美元+,市值近 3 兆!結果蜜月期只維持 11 天,6 月 22 日單日暴跌 16%,7 月直接跌破發行價,最新報 133-140 美元區間。
🤯 來看幾個關鍵數據:
空單占流通股 5-7%,借券成本已回落,空頭輕鬆建倉!
IPO 時 P/S 高達 93 倍,遠超英偉達和亞馬遜!
IPO 後馬上發 250 億債券,債券價格直逼垃圾級,市場直接「惹怒」。
華爾街怎麼解釋?估值太貴、解禁潮要來、AI 敘事還沒兌現利潤,加上宏觀利率壓力,獲利盤瘋狂出逃!
我簡單說下個人觀點:
短期震盪偏弱,解禁和供給壓力還在,但 SpaceX 基本面依然硬核——星鏈增長、星艦復用、AI 算力協同,馬斯克執行力從來不缺!
這不是崩盤,是高估值後的正常洗盤。
但別 All in,控制倉位最重要!
投資有風險,理性決策!
查看原文6 月 12 日,SpaceX 以 135 美元發行價完成史上最大 IPO,首周衝到 200 美元+,市值近 3 兆!結果蜜月期只維持 11 天,6 月 22 日單日暴跌 16%,7 月直接跌破發行價,最新報 133-140 美元區間。
🤯 來看幾個關鍵數據:
空單占流通股 5-7%,借券成本已回落,空頭輕鬆建倉!
IPO 時 P/S 高達 93 倍,遠超英偉達和亞馬遜!
IPO 後馬上發 250 億債券,債券價格直逼垃圾級,市場直接「惹怒」。
華爾街怎麼解釋?估值太貴、解禁潮要來、AI 敘事還沒兌現利潤,加上宏觀利率壓力,獲利盤瘋狂出逃!
我簡單說下個人觀點:
短期震盪偏弱,解禁和供給壓力還在,但 SpaceX 基本面依然硬核——星鏈增長、星艦復用、AI 算力協同,馬斯克執行力從來不缺!
這不是崩盤,是高估值後的正常洗盤。
但別 All in,控制倉位最重要!
投資有風險,理性決策!
- 打賞
- 按讚
- 回覆
- 轉發
- 分享
7🈷️17日 $BTC 綜合行情分析
🤯消息面:
ETF資金流改善但不穩定:7月初美國現貨比特幣ETF出現淨流入(如7月6日約$266M),結束6月創紀錄流出(超過 45 億美元),但部分日子轉為小幅流出。機構需求回暖是支撐價格反彈的關鍵,但尚未形成持續強勢
其他事件:Strategy等大戶減持影響有限,市場快速消化;地緣政治(如與伊朗相關)和宏觀數據(如CPI)偶爾引發波動,但BTC相對抗跌。監管(如CLARITY Act)預期提供潛在利好
🤯資金面:
資金費率:永續合約資金費率溫和正值(約+0.01%左右,年化數%),顯示多空平衡,無極端擁擠。短期擠空後,OI(未平倉權益)有所回落,表明槓桿參與度一般,上漲可持續性需觀察
鏈上數據:大量供應仍處於浮虧狀態(超50%),長期持有者實現虧損增加,但賣壓有緩解跡象。 realized losses接近歷史高位,暗示底部構建中
ETF與機構:流入轉正是積極信號,但規模有限,需持續觀察。
🤯技術面:
當下比特幣又即將變盤,日線級別來到了EMA 30線的支撐進行回踩,但短期要留意回調風險,要關注一小時及四小時級別的回調,下方支撐在63400到62200,所以總結來看,日內短期會有回調,這個位置多空都有機會
查看原文🤯消息面:
ETF資金流改善但不穩定:7月初美國現貨比特幣ETF出現淨流入(如7月6日約$266M),結束6月創紀錄流出(超過 45 億美元),但部分日子轉為小幅流出。機構需求回暖是支撐價格反彈的關鍵,但尚未形成持續強勢
其他事件:Strategy等大戶減持影響有限,市場快速消化;地緣政治(如與伊朗相關)和宏觀數據(如CPI)偶爾引發波動,但BTC相對抗跌。監管(如CLARITY Act)預期提供潛在利好
🤯資金面:
資金費率:永續合約資金費率溫和正值(約+0.01%左右,年化數%),顯示多空平衡,無極端擁擠。短期擠空後,OI(未平倉權益)有所回落,表明槓桿參與度一般,上漲可持續性需觀察
鏈上數據:大量供應仍處於浮虧狀態(超50%),長期持有者實現虧損增加,但賣壓有緩解跡象。 realized losses接近歷史高位,暗示底部構建中
ETF與機構:流入轉正是積極信號,但規模有限,需持續觀察。
🤯技術面:
當下比特幣又即將變盤,日線級別來到了EMA 30線的支撐進行回踩,但短期要留意回調風險,要關注一小時及四小時級別的回調,下方支撐在63400到62200,所以總結來看,日內短期會有回調,這個位置多空都有機會

- 打賞
- 按讚
- 回覆
- 轉發
- 分享
最近這一波行情漲上去了之後,就開始有很多人都在問:
接下來熊市見底,該怎麼布局❓️
我覺得答案很簡單——別急著去尋找或者去追那些所謂的百倍幣,市場的邏輯發生了變化,先把核心資產看明白
在這一輪週期裡,真正值得長期持有的其實就那麼幾個關鍵標的物(DYOR)
加密貨幣:BTC(價值儲存王者)、ETH(生態龍頭)、HYPE(新興高潛力)、BNB(交易平台受益)、SOL(高速度新一代公鏈)。
股票:MSTR(比特幣金融化先鋒)、CRCL(相關生態)、COIN(加密交易平台)、HOOD(散戶入口)。
以上是穩健收益性👆
這些資產各自代表不同邏輯:有的守住底層價值,有的抓住生態擴張,有的直接吃交易流量和比特幣槓桿紅利。
我自己的價值投資,我更偏好「慢就是快」的打法。熊市尾聲往往是普通人最好的上車窗口,但前提是選對核心資產後耐心持有,而不是頻繁換倉。真正拉開收益差距的,從來不是交易次數,而是持倉品質和對週期的理解
有人喜歡穩一點,睡得香;有人願意承受波動去拚更高收益——這都沒錯,關鍵是匹配自己的風險偏好,別被FOMO衝昏頭。
市場給普通人的最大禮物,往往就是在正確的大週期裡,挑對少數優質資產,然後安靜等待複利發酵。
查看原文接下來熊市見底,該怎麼布局❓️
我覺得答案很簡單——別急著去尋找或者去追那些所謂的百倍幣,市場的邏輯發生了變化,先把核心資產看明白
在這一輪週期裡,真正值得長期持有的其實就那麼幾個關鍵標的物(DYOR)
加密貨幣:BTC(價值儲存王者)、ETH(生態龍頭)、HYPE(新興高潛力)、BNB(交易平台受益)、SOL(高速度新一代公鏈)。
股票:MSTR(比特幣金融化先鋒)、CRCL(相關生態)、COIN(加密交易平台)、HOOD(散戶入口)。
以上是穩健收益性👆
這些資產各自代表不同邏輯:有的守住底層價值,有的抓住生態擴張,有的直接吃交易流量和比特幣槓桿紅利。
我自己的價值投資,我更偏好「慢就是快」的打法。熊市尾聲往往是普通人最好的上車窗口,但前提是選對核心資產後耐心持有,而不是頻繁換倉。真正拉開收益差距的,從來不是交易次數,而是持倉品質和對週期的理解
有人喜歡穩一點,睡得香;有人願意承受波動去拚更高收益——這都沒錯,關鍵是匹配自己的風險偏好,別被FOMO衝昏頭。
市場給普通人的最大禮物,往往就是在正確的大週期裡,挑對少數優質資產,然後安靜等待複利發酵。

- 打賞
- 按讚
- 回覆
- 轉發
- 分享
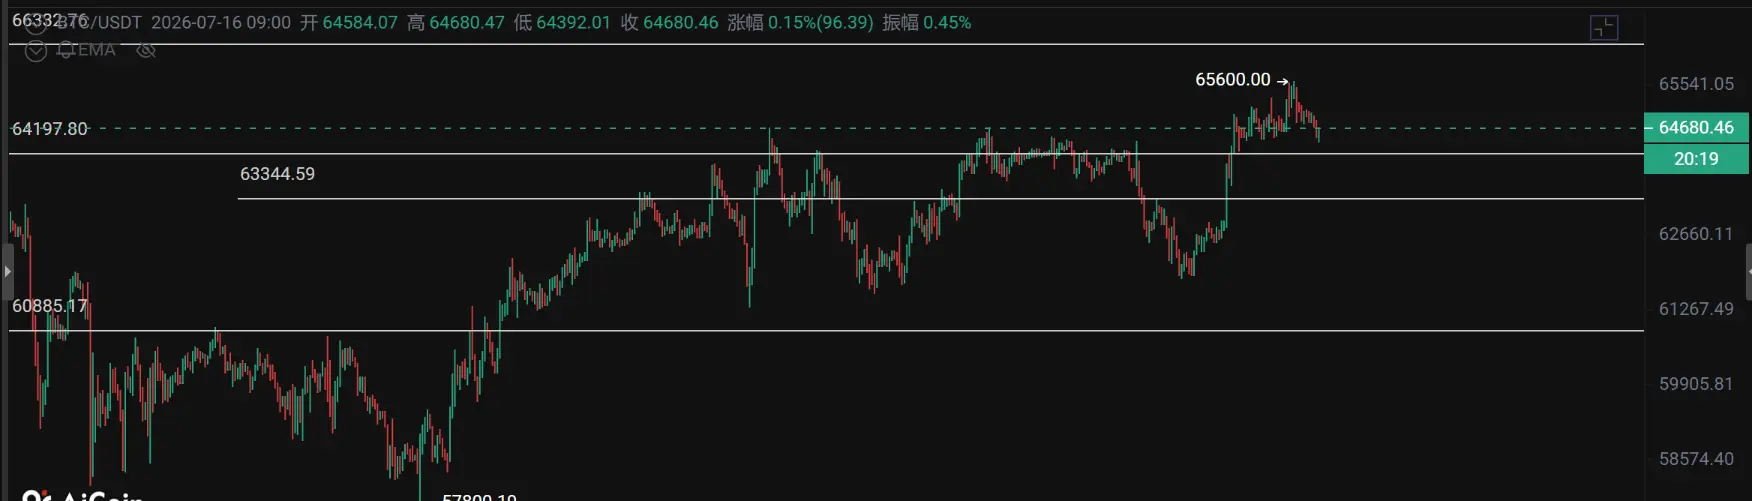
7🈷️16日 $BTC 综合行情分析
🤯消息面:
6月CPI于7月14-15日左右发布,通胀数据整体“偏冷”,市场解读为美联储7月加息概率大幅下降(CME FedWatch显示相关概率从40%+骤降至10-13%附近)。这与此前市场对高通胀的担忧形成反转,直接提振了BTC等风险资产
同时有报道提及PPI数据也偏软,进一步强化了“通胀见顶/降温”的叙事。整体属于典型的宏观利好驱动的反弹,而非单纯技术性反弹
🤯资金面:
ETF资金:美股现货比特币ETF净流入1.81亿美元,彻底扭转前一日约4.25亿美元的流出。BlackRock IBIT单日流入约1.39亿美元,占比超75%,Fidelity FBTC也贡献约2100万美元
这显示机构资金在回调后积极回补,而非持续抛售。6月曾出现大规模流出(部分数据称单月纪录级别),7月至今呈现“先出后回”的震荡修复特征
衍生品/杠杆资金:CPI发布后60分钟内短仓爆仓约1.05–1.34亿美元(全市场24小时短仓主导,占比超80%),总加密清算约3.55–3.76亿美元。短挤效应显著,放大了现货涨幅,但也意味着部分杠杆已出清,为后续上涨扫清部分障碍
资金面总结:从“持续流出压力”转向“机构回流+杠杆出清”的积极信号,但仍需观察是否形成持续多日流入趋势
🤯技术面:
昨天ppi数据延续了前天CPI数据的利好,当下这个位置比特币又即将去变盘。
- 打賞
- 按讚
- 回覆
- 轉發
- 分享
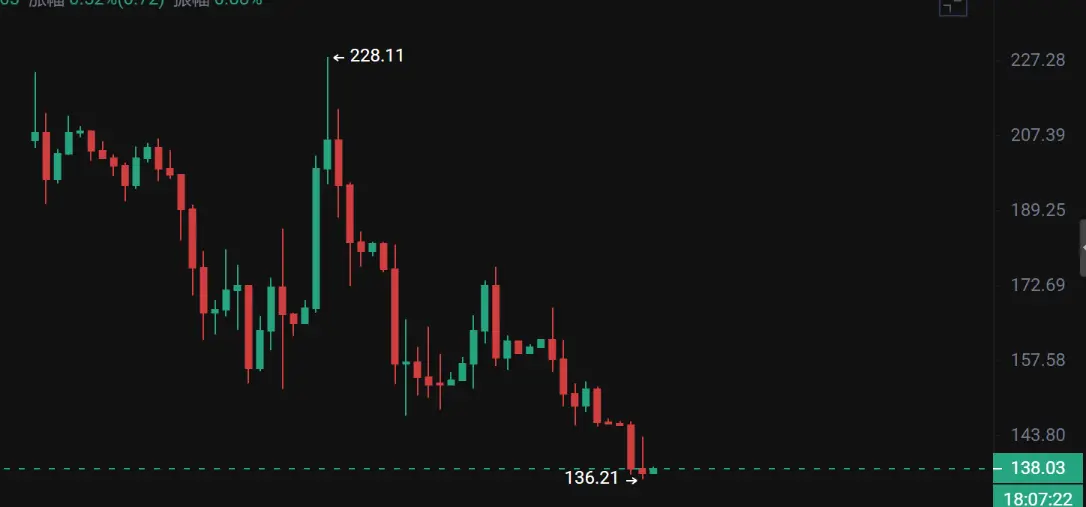
SPCX 上線衝高至 228 美元,目前 137 美元,回調了 40%
基本接近了 BTC 一年的跌幅 📉
主要還是因為這兩點:
1、當前估值偏高:SPCX 市值約 2 萬億美元(股價約 145-150 美元),對應 2025 年營收約 187 億美元的 P/S 倍數超過 100 倍,是歷史極端水準
2、公司仍處於整體虧損(AI 業務巨虧拖累),星鏈雖盈利但增長放緩,Morningstar 等機構認為公允價值僅約 7800 億美元(每股 62 美元左右)
大家最關心的就是 SpaceX 到底值不值這個價?深度拆解三大核心業務!🚀
1️⃣ 航天發射(Space):獵鷹 + 星艦絕對壟斷,全球發射份額超過 80%,但星艦研發仍屬策略性虧損,燒錢為未來鋪路。
2️⃣ 星鏈(Connectivity):現金牛!1030 萬用戶、營收占比超過 60%、49.8% 高增長,唯一穩定盈利板塊,反哺整個集團。
3️⃣ AI 業務:最大的想象空間,算力 + 軌道數據中心,2025 年雖巨虧,但潛在市場萬億美元級,馬斯克的終極閉環。
所以,總結來看短期確實會因多重因素導致價格受阻,但是長期價值投資依然是個不錯的標的物 🔥
SPCX-1.87%
- 打賞
- 1
- 1
- 轉發
- 分享
辣手屯币:
🤗🤪🤔🤗☺️🤔😏😚🤤😏😚🤤😏😚🤤😏😚🤤😏😚🤤😙😊🤔😙😊🤔😙☺️🤔📊 今晚20:30美國6月PPI數據來襲!上游通膨信號關鍵,結合CPI看市場走向
昨天CPI headline回落明顯(預期3.8%),但core仍偏黏。今晚PPI(生產者價格指數)作為上游指標,將進一步驗證通膨路徑。
市場一致預期:
- Headline PPI:環比0.0% ~ +0.2%(前值+1.1%),同比約6.3%(前值6.5%)
- Core PPI(剔除食品能源):環比 +0.4%
- Ex food/energy/trade services:環比放緩至+0.4%(前值+0.8%)
個人簡要預測:
- 基準情境:數據符合或略偏軟於預期(能源拖累明顯)→ 強化「通膨見頂回落」敘事,9月升息機率(目前50%+)可能小幅回落,美債殖利率回調,科技/成長股或獲支撐。
- 風險情境:若core或核心商品超預期走熱 → 確認成本壓力仍在管道中,升息定價進一步升溫,市場波動加大。
- PPI往往領先CPI信號,上游壓力若持續,將影響企業獲利與後續消費通膨。
- 叠加中東地緣因素(油價波動),今晚數據對Fed 7月會議前最後一塊通膨拼圖至關重要。
總結來看 ,PPI若如預期降溫,是對CPI的正面延續;若黏性超預期,則強化鷹派路徑。短期看數據「軟著陸」機率較高,但地緣與核心黏性仍是變數。
你認為今晚PPI會是「利好確認」還是繼續推高升息預期?今晚見分曉!👀
查看原文昨天CPI headline回落明顯(預期3.8%),但core仍偏黏。今晚PPI(生產者價格指數)作為上游指標,將進一步驗證通膨路徑。
市場一致預期:
- Headline PPI:環比0.0% ~ +0.2%(前值+1.1%),同比約6.3%(前值6.5%)
- Core PPI(剔除食品能源):環比 +0.4%
- Ex food/energy/trade services:環比放緩至+0.4%(前值+0.8%)
個人簡要預測:
- 基準情境:數據符合或略偏軟於預期(能源拖累明顯)→ 強化「通膨見頂回落」敘事,9月升息機率(目前50%+)可能小幅回落,美債殖利率回調,科技/成長股或獲支撐。
- 風險情境:若core或核心商品超預期走熱 → 確認成本壓力仍在管道中,升息定價進一步升溫,市場波動加大。
- PPI往往領先CPI信號,上游壓力若持續,將影響企業獲利與後續消費通膨。
- 叠加中東地緣因素(油價波動),今晚數據對Fed 7月會議前最後一塊通膨拼圖至關重要。
總結來看 ,PPI若如預期降溫,是對CPI的正面延續;若黏性超預期,則強化鷹派路徑。短期看數據「軟著陸」機率較高,但地緣與核心黏性仍是變數。
你認為今晚PPI會是「利好確認」還是繼續推高升息預期?今晚見分曉!👀

- 打賞
- 按讚
- 回覆
- 轉發
- 分享
7🈷️15日 $BTC 综合行情分析
🤯消息面:
昨天美国6月CPI数据发布:
环比下降0.4%(预期-0.1%),同比约3.5-3.9%(低于预期3.8%,前值4.2%)。
核心CPI同比2.6%(低于预期2.8%)
这强化美联储降息预期,风险资产反弹,比特币从62k下方快速拉升至64k+,日内涨幅约3-5%
负面因素:美国政府钱包向Coinbase Prime转移约2.88亿美元扣押BTC/ETH,引发卖压担忧;美伊等地缘紧张持续,油价波动可能传导风险。整体消息面利多但有不确定性,市场在“底部反弹 vs 继续震荡”间博弈
🤯资金面:
7月13日:US Spot Bitcoin ETF净流出约4.247亿美元
近期改善:7月初已打破8-10周连续流出纪录(例如7月2日单日+2.23亿,7月2-7日累计+5.1亿;周净流入约1.97亿)。7月11-13日小幅波动,但整体从6月/7月初巨额流出(单月/周数十亿)转向企稳
链上/机构视角:交易所余额持续下降,鲸鱼/ETF持仓(~130万BTC)在低位积累,显示长期需求仍在。但短期ETF赎回+轮动导致价格承压。资金面核心信号:低位有机构捡筹,但需持续流入确认趋势反转
🤯技术面:
昨天就跟大家说了,这个位置短期是会有反弹的
短期:震荡偏强反弹。CPI利好是主驱动,已突破64k,但资金波动(昨日大流出)+政府抛售+地缘风险易导致回踩6
查看原文🤯消息面:
昨天美国6月CPI数据发布:
环比下降0.4%(预期-0.1%),同比约3.5-3.9%(低于预期3.8%,前值4.2%)。
核心CPI同比2.6%(低于预期2.8%)
这强化美联储降息预期,风险资产反弹,比特币从62k下方快速拉升至64k+,日内涨幅约3-5%
负面因素:美国政府钱包向Coinbase Prime转移约2.88亿美元扣押BTC/ETH,引发卖压担忧;美伊等地缘紧张持续,油价波动可能传导风险。整体消息面利多但有不确定性,市场在“底部反弹 vs 继续震荡”间博弈
🤯资金面:
7月13日:US Spot Bitcoin ETF净流出约4.247亿美元
近期改善:7月初已打破8-10周连续流出纪录(例如7月2日单日+2.23亿,7月2-7日累计+5.1亿;周净流入约1.97亿)。7月11-13日小幅波动,但整体从6月/7月初巨额流出(单月/周数十亿)转向企稳
链上/机构视角:交易所余额持续下降,鲸鱼/ETF持仓(~130万BTC)在低位积累,显示长期需求仍在。但短期ETF赎回+轮动导致价格承压。资金面核心信号:低位有机构捡筹,但需持续流入确认趋势反转
🤯技术面:
昨天就跟大家说了,这个位置短期是会有反弹的
短期:震荡偏强反弹。CPI利好是主驱动,已突破64k,但资金波动(昨日大流出)+政府抛售+地缘风险易导致回踩6
- 打賞
- 按讚
- 回覆
- 轉發
- 分享
今晚 20:30 美國 6 月 CPI 重磅來襲!市場已部分定價 9 月加息,數據會怎麼影響?
一致預期:
- headline CPI:環比 -0.1%,同比 3.8%(前值 4.2%)
- Core CPI:環比 +0.2%,同比 2.9%(前值 2.9%)
簡要預測:
- 最可能:headline 明顯回落,core 仍偏黏性 → 市場短期鬆口氣,9 月加息機率(目前 50%+)小幅回落,科技/成長股或反彈
- 風險:若 core 超預期偏熱(≥3.0%),加息定價會進一步升溫,美債收益率上行,納指承壓
背景:CME FedWatch 顯示 7 月大概率 Hold,但 9 月加息已被市場消化。今晚數據是 7 月 FOMC 前最後重要的通膨讀數,決定短期風向!
你覺得會「利空出盡」還是繼續鷹派?今晚見分曉 👀
查看原文一致預期:
- headline CPI:環比 -0.1%,同比 3.8%(前值 4.2%)
- Core CPI:環比 +0.2%,同比 2.9%(前值 2.9%)
簡要預測:
- 最可能:headline 明顯回落,core 仍偏黏性 → 市場短期鬆口氣,9 月加息機率(目前 50%+)小幅回落,科技/成長股或反彈
- 風險:若 core 超預期偏熱(≥3.0%),加息定價會進一步升溫,美債收益率上行,納指承壓
背景:CME FedWatch 顯示 7 月大概率 Hold,但 9 月加息已被市場消化。今晚數據是 7 月 FOMC 前最後重要的通膨讀數,決定短期風向!
你覺得會「利空出盡」還是繼續鷹派?今晚見分曉 👀

- 打賞
- 按讚
- 回覆
- 轉發
- 分享
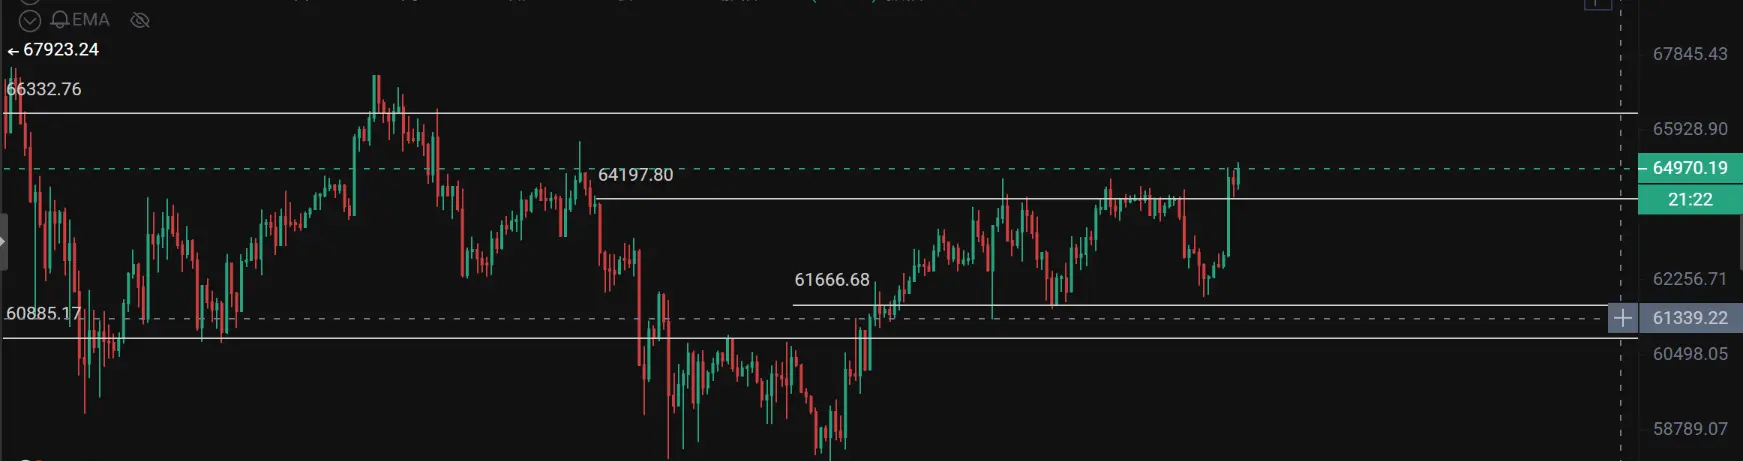
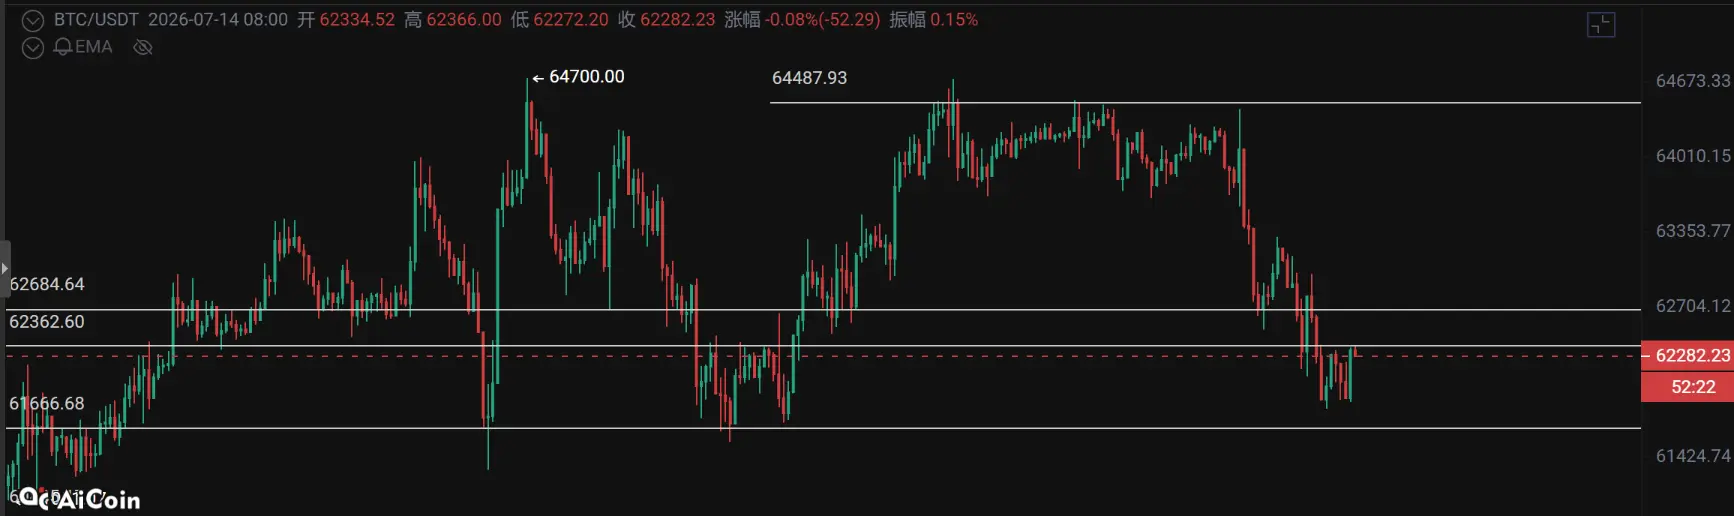
7🈷️14日 $BTC 綜合行情分析
🤯消息面:
美伊霍爾木茲海峽緊張局勢升級是昨日最大變量:
伊朗宣布海峽「關閉」,美國對伊朗目標發動打擊
油價因此承壓上漲,但比特幣僅小幅波動(多數時段跌幅0.3%–3%),顯示加密市場對地緣風險的定價已趨成熟,BTC作為「宏觀對沖資產」的屬性正在顯現。
🤯資金面:
機構資金正在低位逐步回流,這是目前最重要的支撐因素:
7月10日:美國現貨BTC ETF淨流入 +$90.4M(BlackRock IBIT貢獻 +86.8M)
7月13日:接近持平(小幅淨流入約 +$0.3M)
7月初已出現連續流入,結束了此前較長時間的流出潮
核心結論:聰明錢(尤其是IBIT)在當前區間開始低位吸籌,這為價格提供了真實買盤支撐,而非單純的投機反彈
🤯技術面:
昨天給大家的思路是會以回調為主,那昨天基本從高位開始就一路進行了回調,那目前回調到了前期的區間 61700-62400
目前從短期來看,還沒有完全回調到位。接下來面對的是日線 macd 0 軸的阻力,同時要關注的是前期區間 61700 是否能夠去跌破?如果不跌破,在這裡震盪會走出一筆 15 分鐘級別的反彈,那反彈的力度不會很大,上方可能會圍繞著 62700 去走。如果去跌破 61600,下方就會圍繞這 60900 附近去走
總結來看,日內依然會以震盪為主,大級別還需要觀察,然後短期會去走一筆 15 分
查看原文🤯消息面:
美伊霍爾木茲海峽緊張局勢升級是昨日最大變量:
伊朗宣布海峽「關閉」,美國對伊朗目標發動打擊
油價因此承壓上漲,但比特幣僅小幅波動(多數時段跌幅0.3%–3%),顯示加密市場對地緣風險的定價已趨成熟,BTC作為「宏觀對沖資產」的屬性正在顯現。
🤯資金面:
機構資金正在低位逐步回流,這是目前最重要的支撐因素:
7月10日:美國現貨BTC ETF淨流入 +$90.4M(BlackRock IBIT貢獻 +86.8M)
7月13日:接近持平(小幅淨流入約 +$0.3M)
7月初已出現連續流入,結束了此前較長時間的流出潮
核心結論:聰明錢(尤其是IBIT)在當前區間開始低位吸籌,這為價格提供了真實買盤支撐,而非單純的投機反彈
🤯技術面:
昨天給大家的思路是會以回調為主,那昨天基本從高位開始就一路進行了回調,那目前回調到了前期的區間 61700-62400
目前從短期來看,還沒有完全回調到位。接下來面對的是日線 macd 0 軸的阻力,同時要關注的是前期區間 61700 是否能夠去跌破?如果不跌破,在這裡震盪會走出一筆 15 分鐘級別的反彈,那反彈的力度不會很大,上方可能會圍繞著 62700 去走。如果去跌破 61600,下方就會圍繞這 60900 附近去走
總結來看,日內依然會以震盪為主,大級別還需要觀察,然後短期會去走一筆 15 分
- 打賞
- 按讚
- 回覆
- 轉發
- 分享
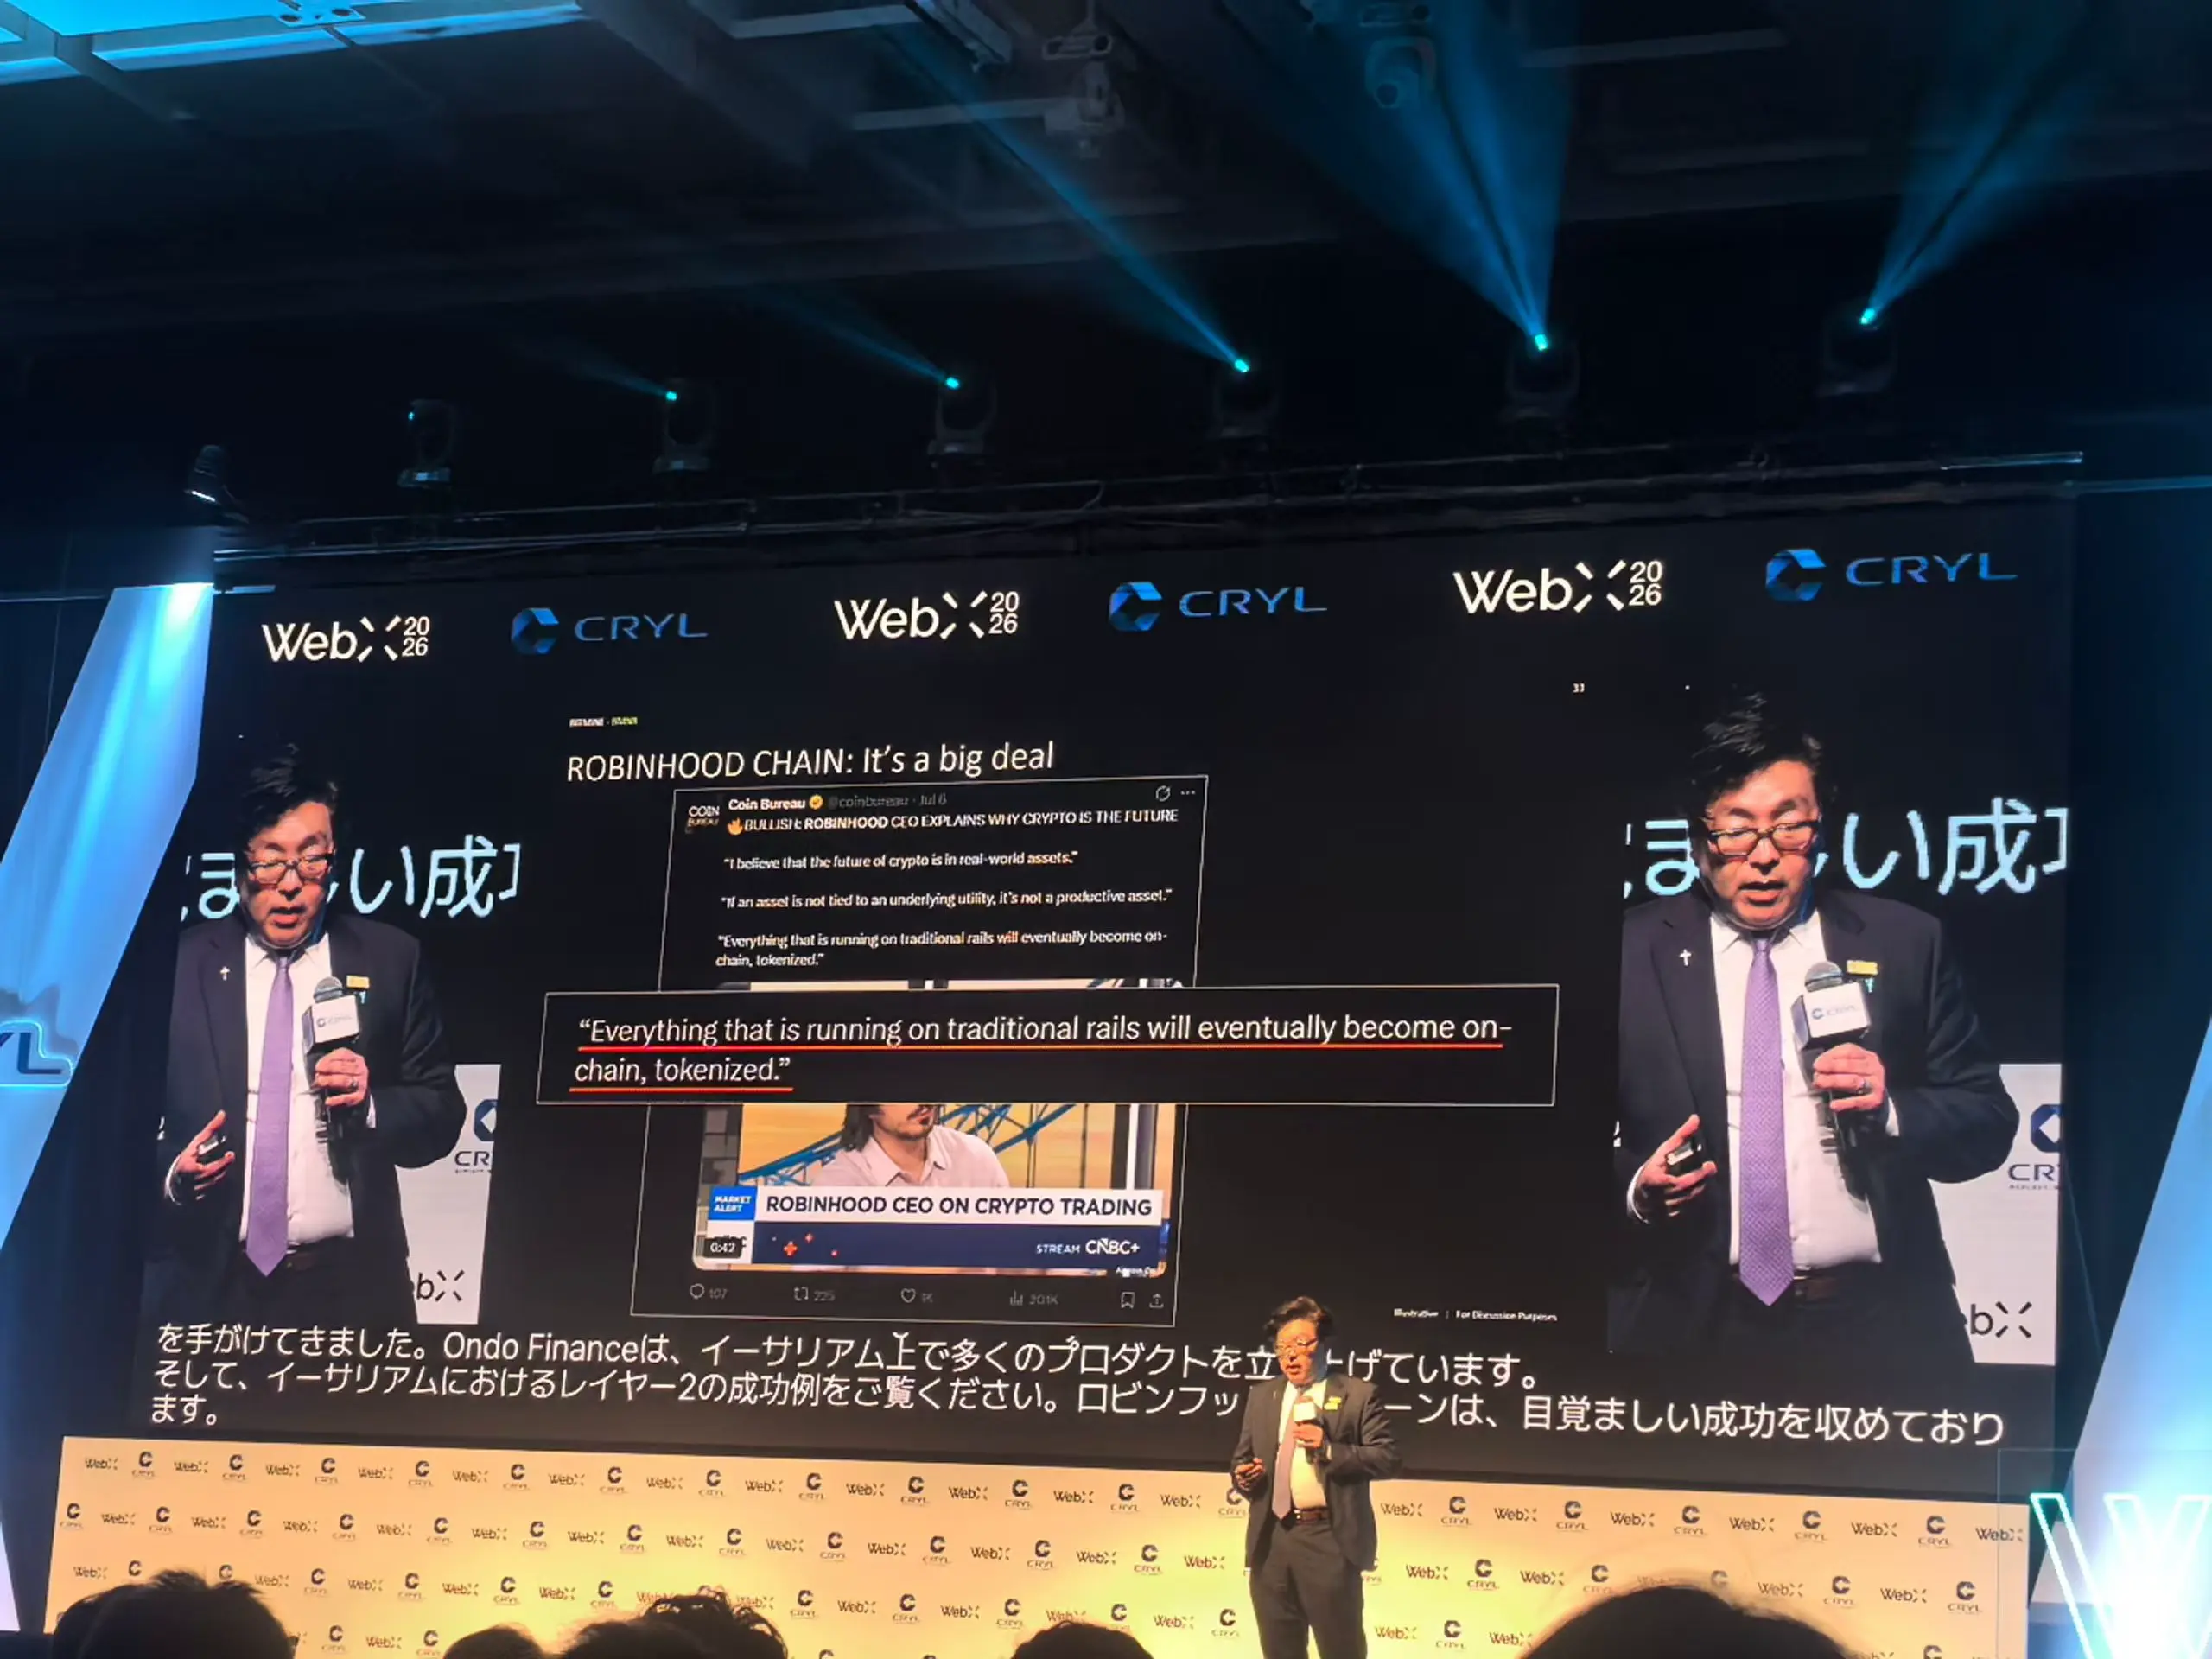
总结一下 TomLee 今天在日本WebX 2026峰会上演讲核心的内容:
以《以太坊:财富恐怖谷的解药》为主题发表演讲,整体基调乐观,重点围绕加密市场底部确认、以太坊(ETH)进入“ETH 2.0”阶段,以及机构级布局展开。
主要观点:
1. 加密市场已处于底部,四大逆风基本消化:
- 美联储政策转向、《清晰法案》悬而未决、资金流向AI及金融股、整体情绪低迷等因素导致今年疲软。
- 但这些逆风已基本被市场吸收,目前处于**底部区域**,即将迎来转机。
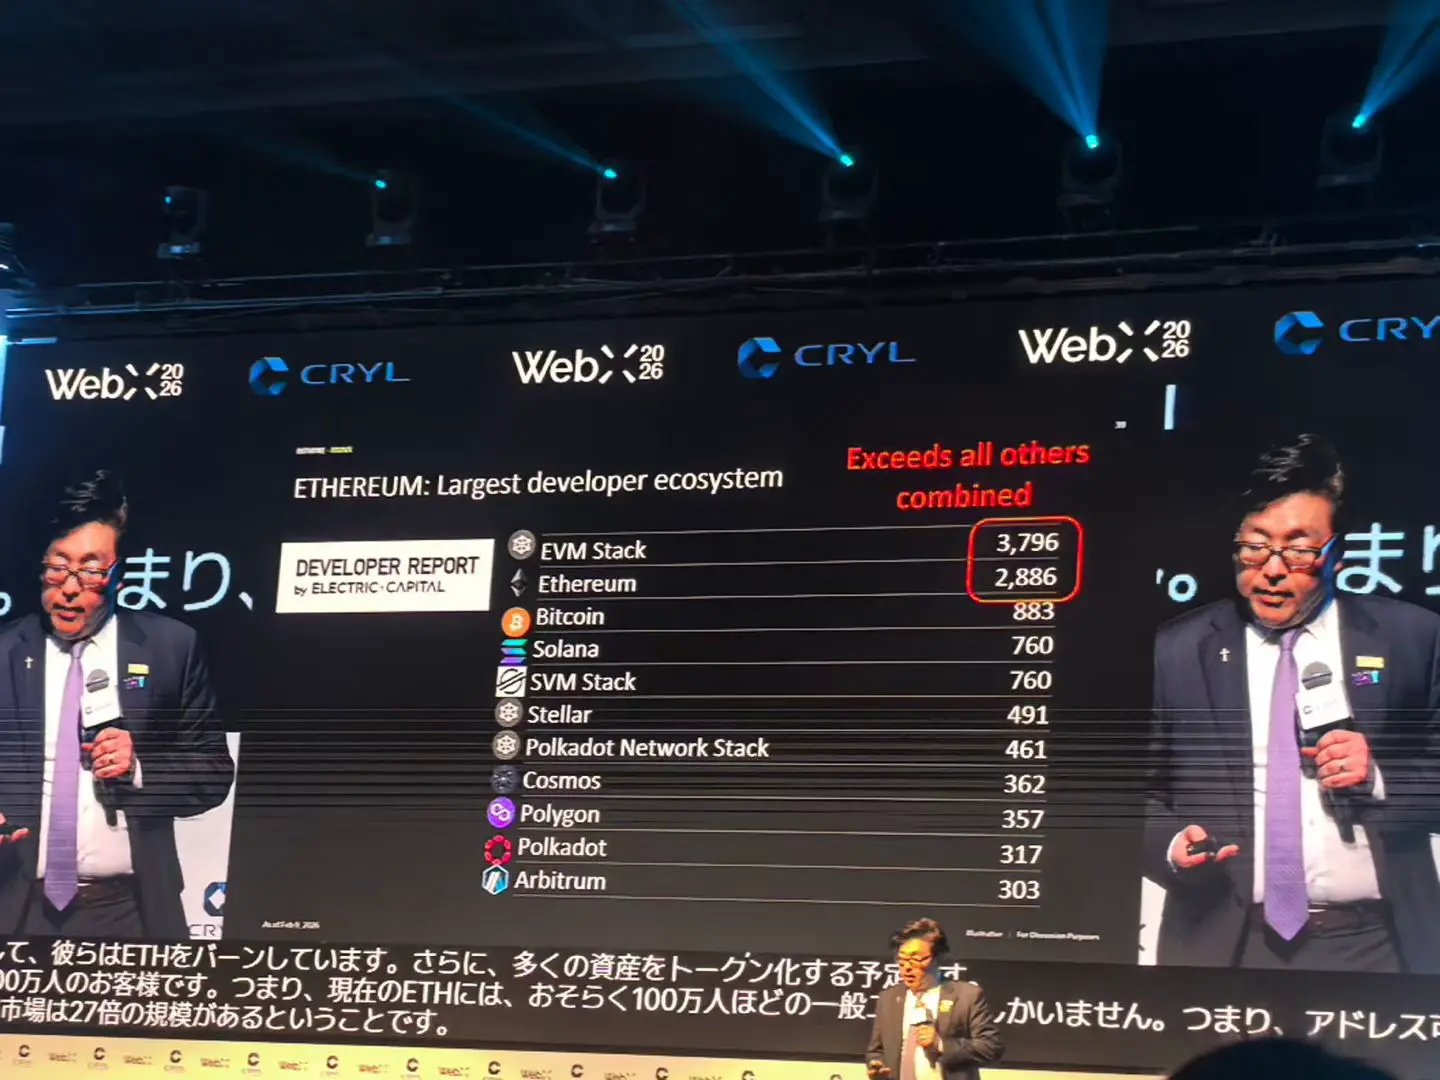
2. 以太坊进入“ETH 2.0”新时代:
- 类比亚马逊、英伟达、摩根大通的“1.0到2.0”估值跃迁
- 增长支柱包括:新基金会体系、代理型AI、金融结算层等
- 重申“ETH即货币”观点,长期目标价看向25万美元(距离目前还有138倍)
- ETH是解决财富恐怖谷的解药,能为机构和用户提供稳定价值存储与应用层。
3. BitMine的ETH布局:
- 目前持有约574万枚ETH(占总供应量约4.8%),其中大部分已质押。
- 未来计划逐步增持至5%供应量(不会急于冲刺,尊重Vitalik不希望单一实体超5%的立场)
- 作为领投方支持以太坊基金会衍生机构:EthLabs和Ethereum Institutional
- 还将继续投资金融服务、加密独角兽及“公共物品”项
查看原文以《以太坊:财富恐怖谷的解药》为主题发表演讲,整体基调乐观,重点围绕加密市场底部确认、以太坊(ETH)进入“ETH 2.0”阶段,以及机构级布局展开。
主要观点:
1. 加密市场已处于底部,四大逆风基本消化:
- 美联储政策转向、《清晰法案》悬而未决、资金流向AI及金融股、整体情绪低迷等因素导致今年疲软。
- 但这些逆风已基本被市场吸收,目前处于**底部区域**,即将迎来转机。
2. 以太坊进入“ETH 2.0”新时代:
- 类比亚马逊、英伟达、摩根大通的“1.0到2.0”估值跃迁
- 增长支柱包括:新基金会体系、代理型AI、金融结算层等
- 重申“ETH即货币”观点,长期目标价看向25万美元(距离目前还有138倍)
- ETH是解决财富恐怖谷的解药,能为机构和用户提供稳定价值存储与应用层。
3. BitMine的ETH布局:
- 目前持有约574万枚ETH(占总供应量约4.8%),其中大部分已质押。
- 未来计划逐步增持至5%供应量(不会急于冲刺,尊重Vitalik不希望单一实体超5%的立场)
- 作为领投方支持以太坊基金会衍生机构:EthLabs和Ethereum Institutional
- 还将继续投资金融服务、加密独角兽及“公共物品”项
- 打賞
- 按讚
- 回覆
- 轉發
- 分享
7🈷️13日 $BTC 綜合行情分析
🤯消息面:
7月12日消息面相對平靜,市場處於「觀望+謹慎恢復」狀態。主要焦點集中在即將到來的宏觀數據上:
核心催化劑:7月14日(明日)美國6月CPI數據(北京時間晚間)。這是7月最大變量
市場預期:整體CPI可能因汽油價格回落而出現負的環比,但核心CPI仍需關注
若CPI偏軟:強化降息預期,利好風險資產,BTC易突破$65,000+。
若CPI偏熱:強化「高利率更久」敘事,壓制BTC,可能回踩$62,000甚至$60,000支撐。
其他背景:美國加密立法此前有積極進展,Circle新信託銀行獲批等基礎設施利好仍在發酵,但昨日無新重大事件。市場對7月1日低點是否為週期底部的討論仍在繼續
🤯資金面:
資金面出現積極轉好訊號,這是支撐當前價格的重要因素
現貨比特幣ETF:在經歷6月底-7月初的連續流出後,近期轉為淨流入
7月11日:+$90.40M(+1.43K BTC)淨流入
7月7日、10日等時段也錄得正流入(IBIT主導)
累計歷史淨流入仍達+$51.72B,總資產約$78B
IBIT仍是最大淨流入者(累計+747K BTC);GBTC持續淨流出(費用結構輪動)
🤯技術面:
週末兩天一直圍繞着63500到64500進行震盪,那這兩天也一直在跟大家提到這波多頭行情想要去走強,就要去關注它是否能夠去站穩64500。那目前來看,無論是K線
查看原文🤯消息面:
7月12日消息面相對平靜,市場處於「觀望+謹慎恢復」狀態。主要焦點集中在即將到來的宏觀數據上:
核心催化劑:7月14日(明日)美國6月CPI數據(北京時間晚間)。這是7月最大變量
市場預期:整體CPI可能因汽油價格回落而出現負的環比,但核心CPI仍需關注
若CPI偏軟:強化降息預期,利好風險資產,BTC易突破$65,000+。
若CPI偏熱:強化「高利率更久」敘事,壓制BTC,可能回踩$62,000甚至$60,000支撐。
其他背景:美國加密立法此前有積極進展,Circle新信託銀行獲批等基礎設施利好仍在發酵,但昨日無新重大事件。市場對7月1日低點是否為週期底部的討論仍在繼續
🤯資金面:
資金面出現積極轉好訊號,這是支撐當前價格的重要因素
現貨比特幣ETF:在經歷6月底-7月初的連續流出後,近期轉為淨流入
7月11日:+$90.40M(+1.43K BTC)淨流入
7月7日、10日等時段也錄得正流入(IBIT主導)
累計歷史淨流入仍達+$51.72B,總資產約$78B
IBIT仍是最大淨流入者(累計+747K BTC);GBTC持續淨流出(費用結構輪動)
🤯技術面:
週末兩天一直圍繞着63500到64500進行震盪,那這兩天也一直在跟大家提到這波多頭行情想要去走強,就要去關注它是否能夠去站穩64500。那目前來看,無論是K線
- 打賞
- 按讚
- 回覆
- 轉發
- 分享
本週(7.13-7.19) Web3 大事件💥
7.13
日本 Siiibo 證券下週一將更名為「Metaplanet 證券」,加速布局 BTC 金融平台
7.14
美國將於 7 月 14 日公布 6 月 CPI 數據;
美聯儲主席沃什將於 7 月 14 日首次在國會作證;
紐約法官暫停 39 萬個休眠比特幣錢包所有權訴訟,7 月 14 日舉行聽證會;
Forsage 聯創 Olena Oblamska 被引渡至美國,陪審團審判預計於 7 月 14 日開始
7.15
美國將於 7 月 15 日公布 6 月 PPI 數據;
美聯儲主席沃什再次出席參議院聽證會;
豆包、千問智能體將於 7 月 15 日下線;
消息人士:SK 海力士美國上市相關外匯交易預計 7 月 15 日前後進行
7.16
長鑫科技將於 7 月 16 日開啟新股申購;
7.17
Gemini 3.5 Pro 或於 7 月 17 日上線
美國眾議院金融服務委員會將於 7 月 17 日就 CLARITY 法案舉行聽證會;
鏈上衍生品協議 Satori 將停止營運,提款將於 7 月 17 日前關閉
🌞其他(具體時間未定)
SK 海力士美國上市帶動槓桿 ETF 熱潮,六款產品下週推出;
美國和伊朗或將於下週舉行新一輪談判
查看原文7.13
日本 Siiibo 證券下週一將更名為「Metaplanet 證券」,加速布局 BTC 金融平台
7.14
美國將於 7 月 14 日公布 6 月 CPI 數據;
美聯儲主席沃什將於 7 月 14 日首次在國會作證;
紐約法官暫停 39 萬個休眠比特幣錢包所有權訴訟,7 月 14 日舉行聽證會;
Forsage 聯創 Olena Oblamska 被引渡至美國,陪審團審判預計於 7 月 14 日開始
7.15
美國將於 7 月 15 日公布 6 月 PPI 數據;
美聯儲主席沃什再次出席參議院聽證會;
豆包、千問智能體將於 7 月 15 日下線;
消息人士:SK 海力士美國上市相關外匯交易預計 7 月 15 日前後進行
7.16
長鑫科技將於 7 月 16 日開啟新股申購;
7.17
Gemini 3.5 Pro 或於 7 月 17 日上線
美國眾議院金融服務委員會將於 7 月 17 日就 CLARITY 法案舉行聽證會;
鏈上衍生品協議 Satori 將停止營運,提款將於 7 月 17 日前關閉
🌞其他(具體時間未定)
SK 海力士美國上市帶動槓桿 ETF 熱潮,六款產品下週推出;
美國和伊朗或將於下週舉行新一輪談判

- 打賞
- 按讚
- 回覆
- 轉發
- 分享