# 技术分析

105.55K
#GateSquareMayTradingShare
Technical Analysis:
Currently, Tesla's small-scale structure is quite clear, with a rebound indication at 340 → the highest peak at 451, an increase of +32.6%, which is quite significant~
But how much it has risen is not the key; where the structure is headed is the focus.
The current price rebound has formed a three-wave structure, with the internal structure of the third wave also approaching completeness. If it is to develop into an upward trend pattern, the marked Wave C needs a larger rally; stopping at the current price level is not acceptable~
Two scenarios:
TSLA-3.50%
post-image
Original content no longer visible
  • Reward
  • 14
  • Repost
  • Share
Yajing:
To The Moon 🌕
View More
On 7/24, K-line pattern deep dive—essential tips you must see for beginners #XAU #缠论 #技术分析
XAU-0.11%
View Original
  • Reward
  • 3
  • Repost
  • Share
GateUser-7a02e90b:
good analysis
View More
🚨 $PEPE Is this drop a “golden pit” or an endless pit? 🚨
Take a look at the 4-hour chart—my heart is half-cold. MA25 (0.00000338) and MA99 (0.00000860) are like two big mountains pressing down, with the price pinned firmly at 0.00000284, a classic bearish alignment. The short-term MA7 may be flattening around 0.00000275, but volume can’t keep up—this kind of “soft support” will be pierced and broken if prodded.
What’s interesting is that today the low touched 0.00000283, exactly brushing the upper edge of the prior high-density trading zone. If this level can’t be held, the lower “vacuum” z
PEPE-3.34%
View Original
  • Reward
  • Comment
  • Repost
  • Share
Today the crypto market rebounded across the board, but the strongest is not BTC—it's SOL, with a daily gain of +4.93%.
Why is SOL so strong? Technically, SOL's SuperTrend indicator is all green across three timeframes (15-minute, 1-hour, 4-hour), making it the cleanest signal among the current mainstream coins.
Rebounded from last week's low of $66, the 4-hour support is at $65.64, and the price today stands at $74.5, nearly $9 above the support.
Structurally, SOL's trend is like this: bottom confirmation → gradual uptrend → bullish signals synchronized across three timeframes → today's
BTC-1.48%
SOL-1.94%
View Original
  • Reward
  • Comment
  • Repost
  • Share
BTC Breaks Below 200-Week Moving Average – Long-Term Bear Signal or Final Panic?
A technical signal has many people panicking: BTC has broken below the 200-week moving average.
In technical analysis, the 200-week moving average is known as the "ultimate bull-bear boundary."
Breaking below it is usually considered a sign of a long-term bear market.
But let’s flip the perspective:
1. The last time BTC broke below the 200-week moving average was at the end of 2022, after which it rallied 300%.
2. The current RSI is already in oversold territory.
3. Options expire tomorrow + end of q
BTC-1.48%
View Original
  • Reward
  • Comment
  • Repost
  • Share
June 11th, learn a little about candlestick charts every day to improve market awareness #技术分析 #缠论
View Original
  • Reward
  • Comment
  • Repost
  • Share
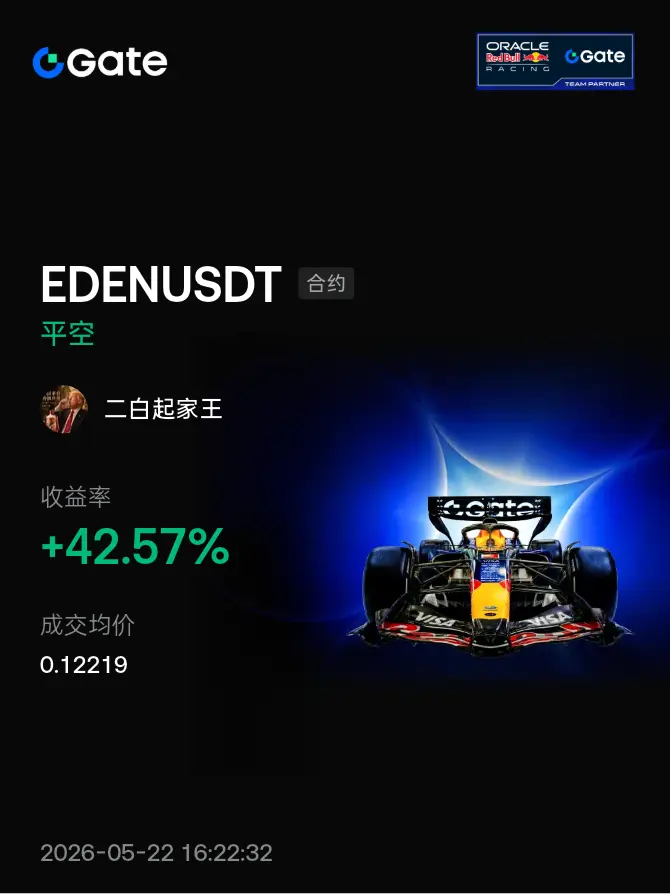
The short army is gathering! Just after this wave, EDENUSDT took profits and closed the short—everything is settled safely! 📈
Many people are blindly bottom-fishing, but they don’t know how heavy the selling pressure above is. My quantitative indicator has already issued a perfect danger signal around 0.122—pinpointing the top! Follow the trend; taking profits is simply a matter of course.
This trade is already in the past. I’ve used a Pine script to screen out the next “high-position reversal” dark-horse coin.
Hurry into the live stream—I'll break down tonight’s short-selling logic and
EDEN-0.77%
View Original
post-image
  • Reward
  • Comment
  • Repost
  • Share
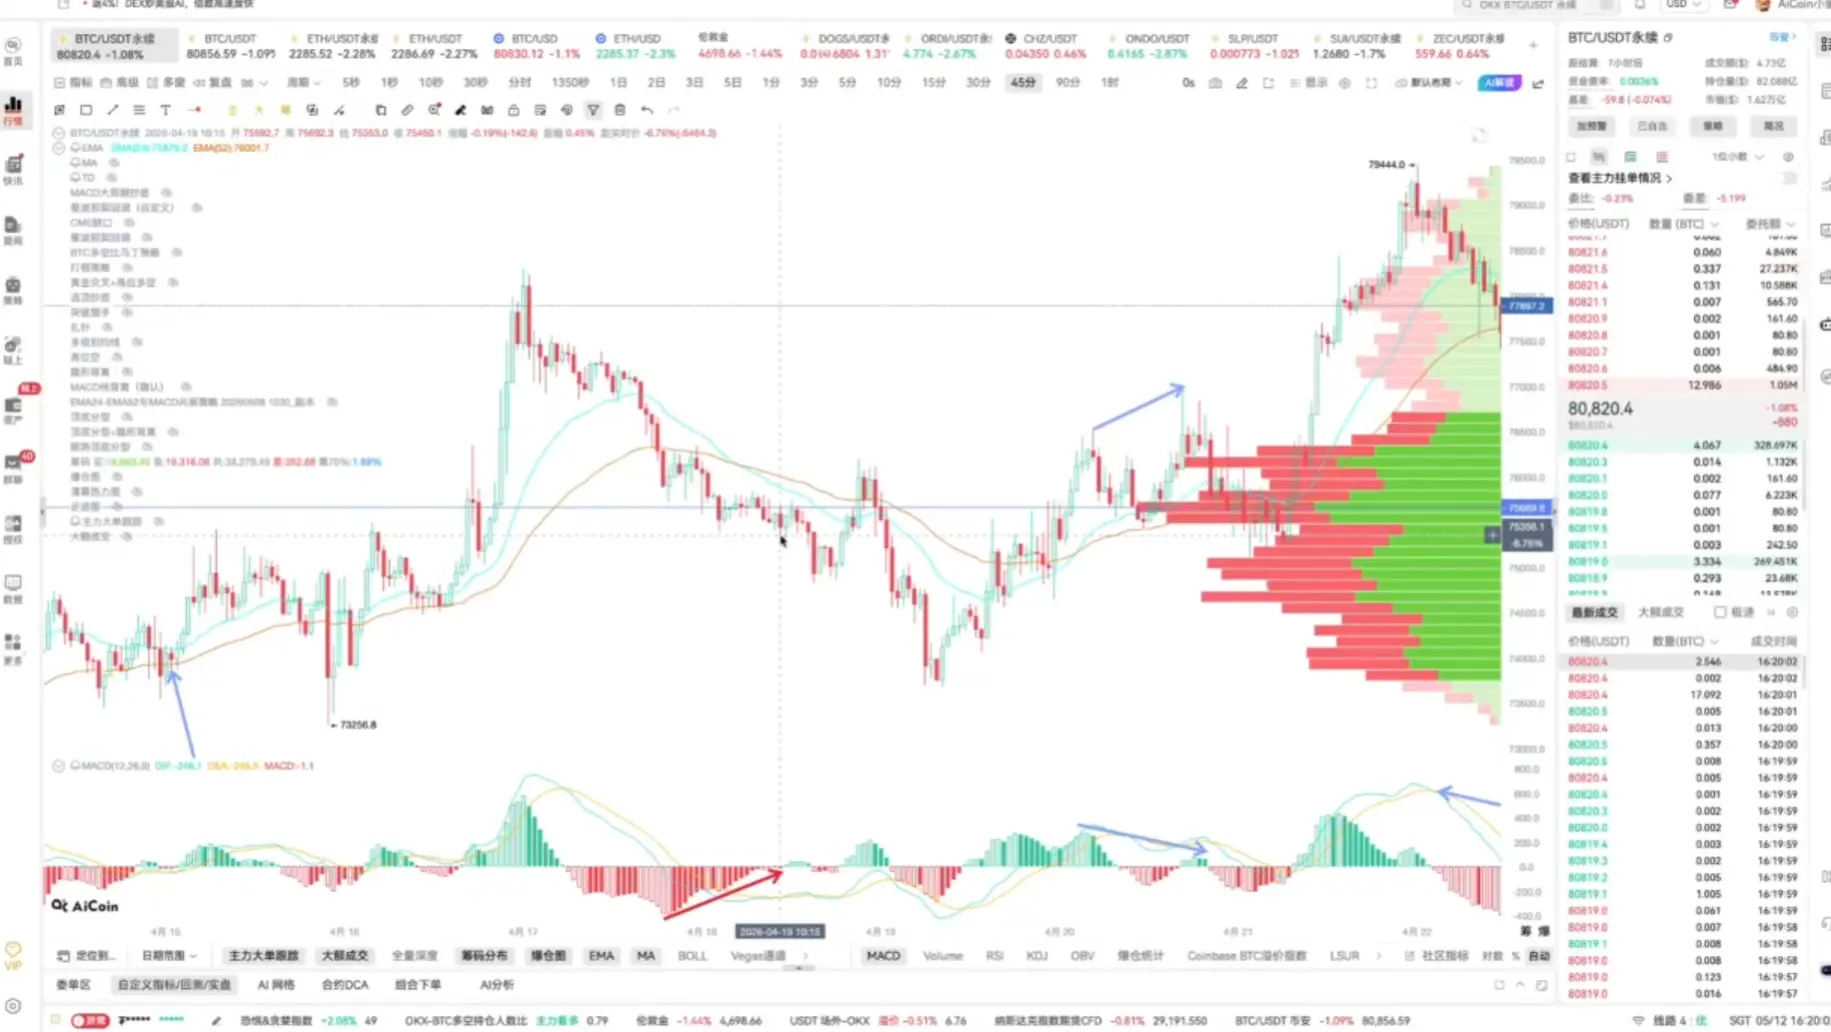
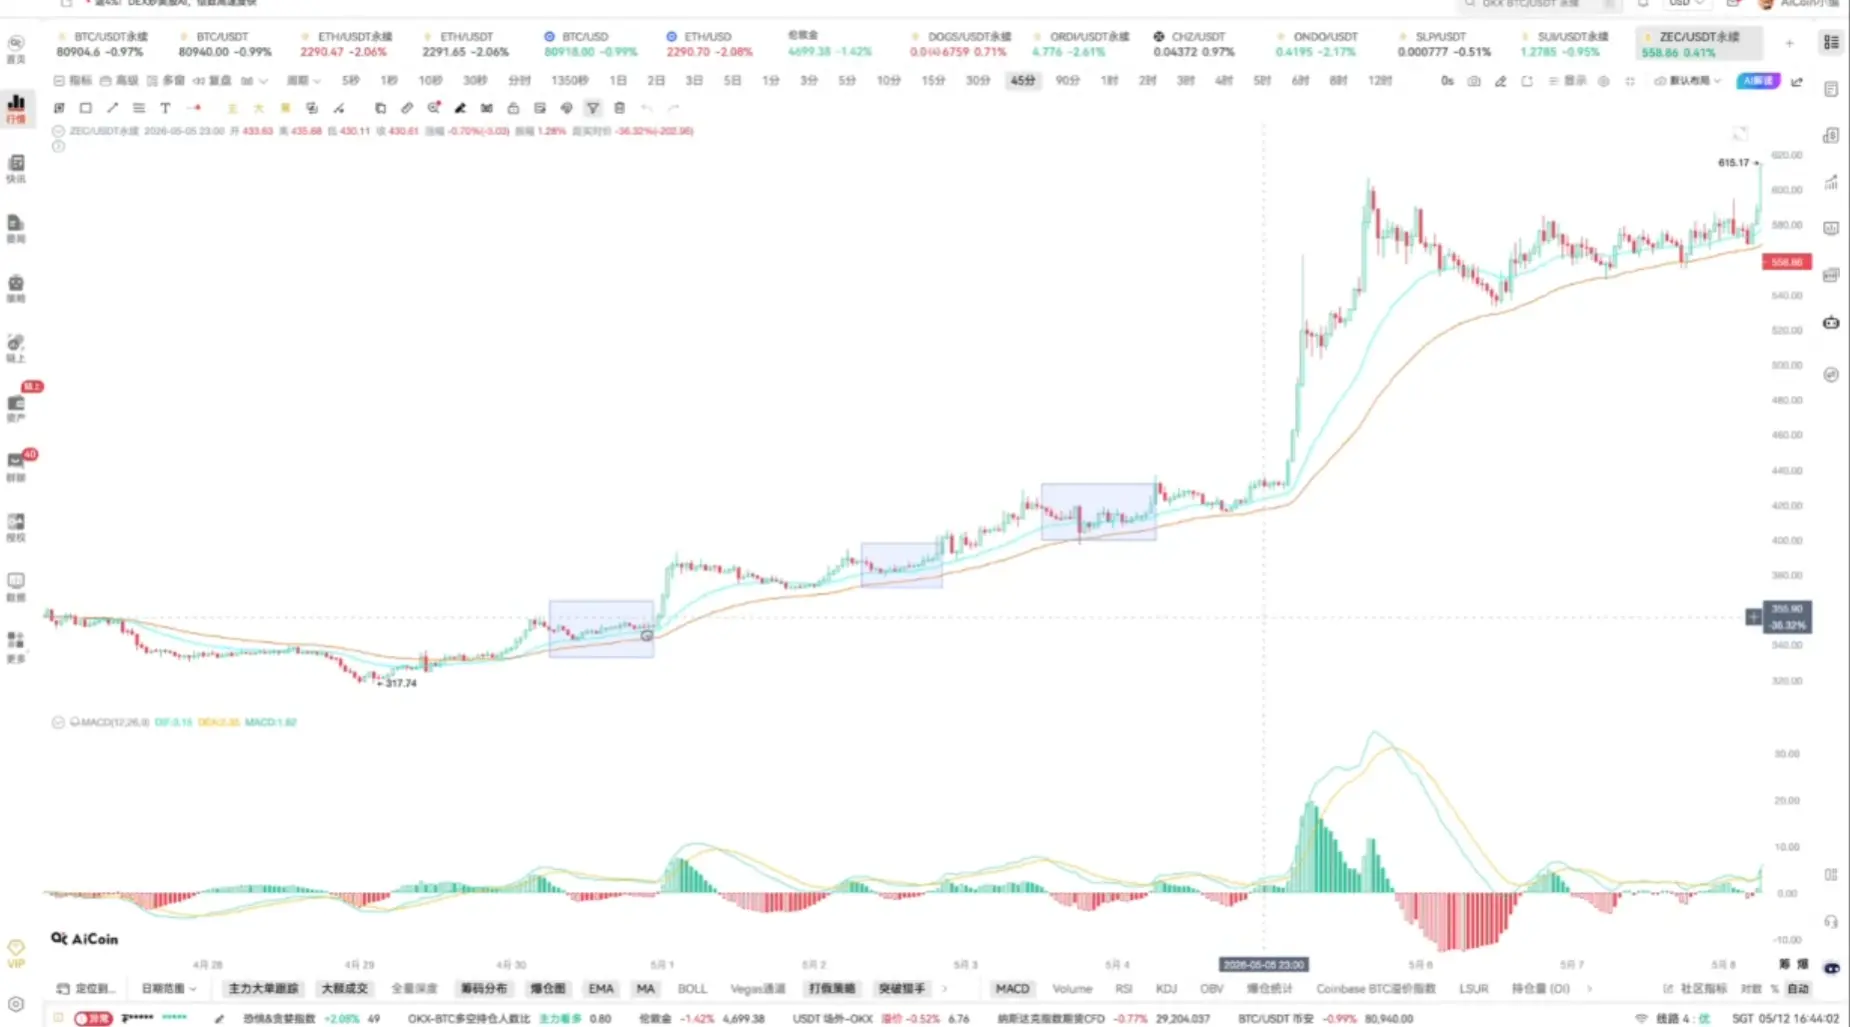
🔥 Trading in the right cycle beats 100 indicators!
Abandon the noisy 15-minute and sluggish 1-hour charts; the 45-minute cycle is the perfect "middle ground" that filters out noise and avoids the trap of the main players.
Core strategy: EMA + MACD + Top/Bottom Divergence
📈 Key settings:
Moving averages: EMA24 & EMA52
MACD: Default (12, 26, 9)
💡 Advanced techniques:
Trend pullback: Price pulling back to EMA52 without breaking is a high-quality buy point.
More accurate divergence: When a top divergence appears with a top pattern, it’s suitable for shorting;
Hidden divergence: New highs but wi
PAXG-0.09%
BTC-1.48%
View Original
post-image
post-image
  • Reward
  • Comment
  • Repost
  • Share
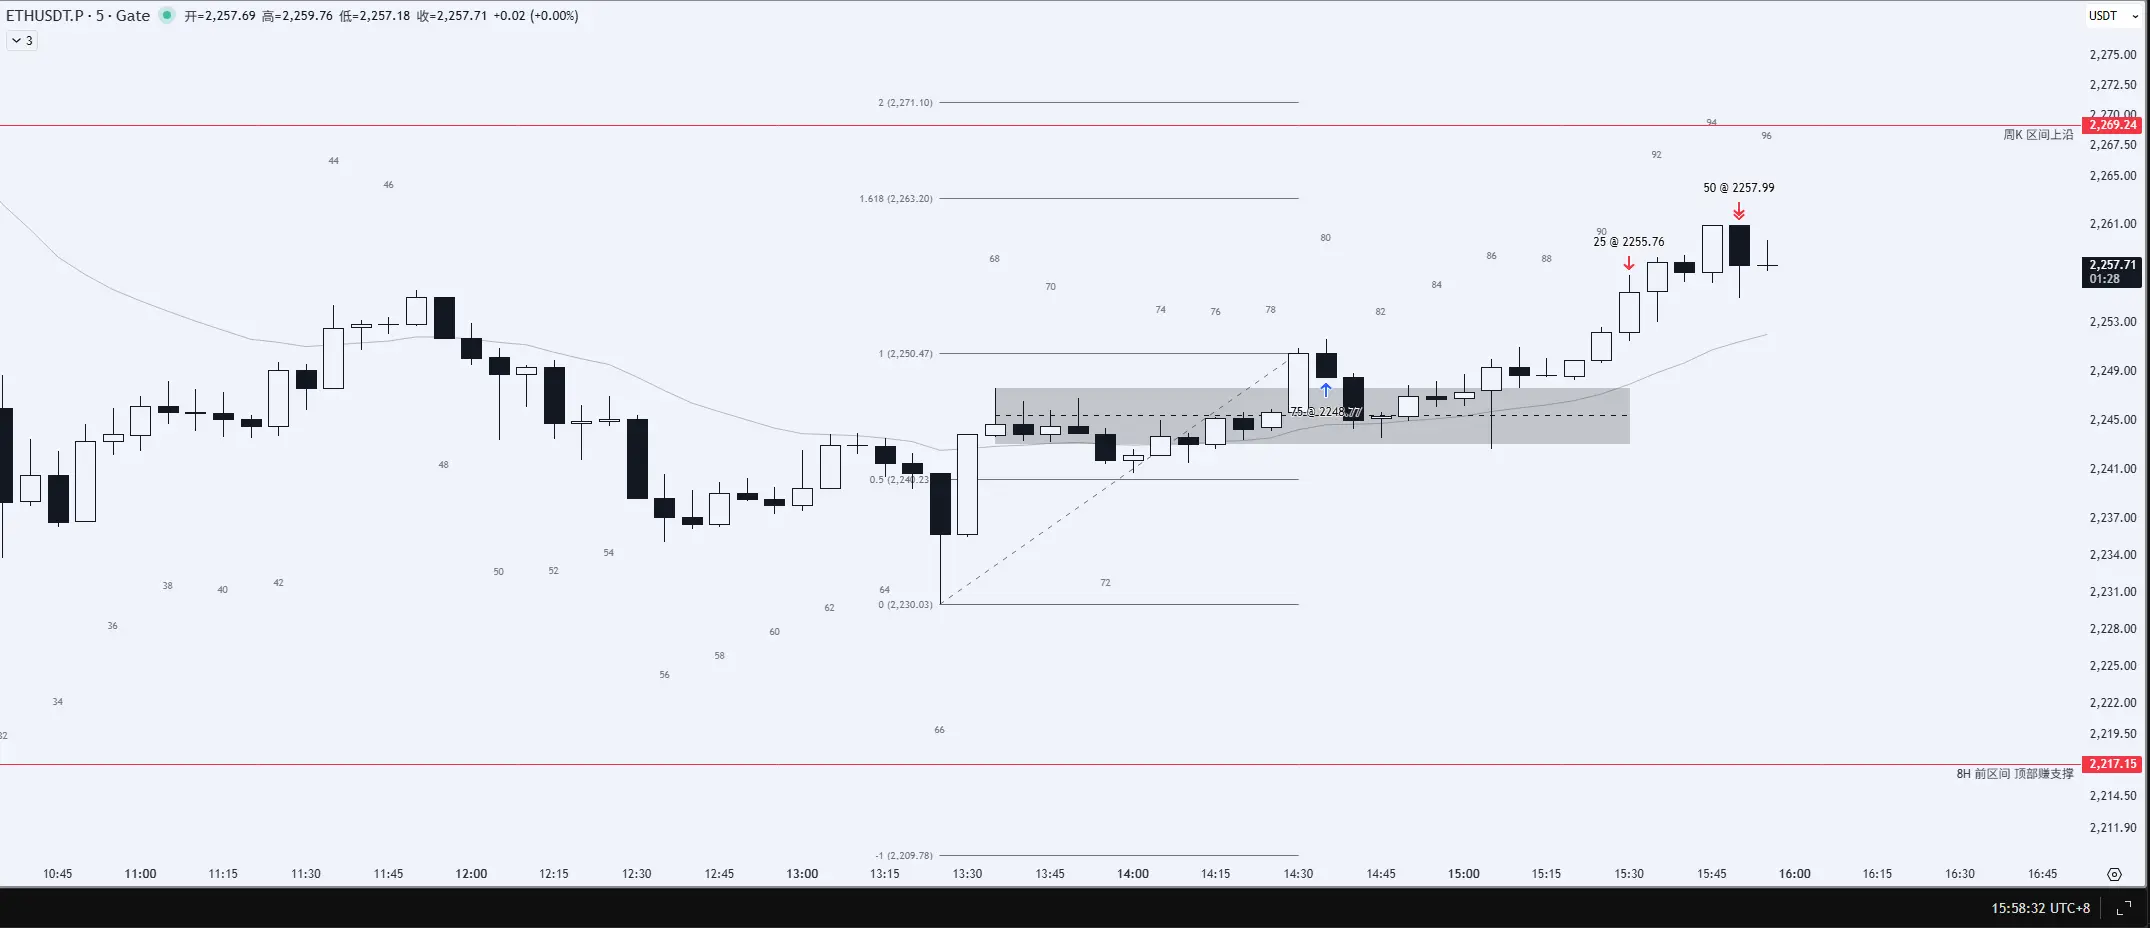
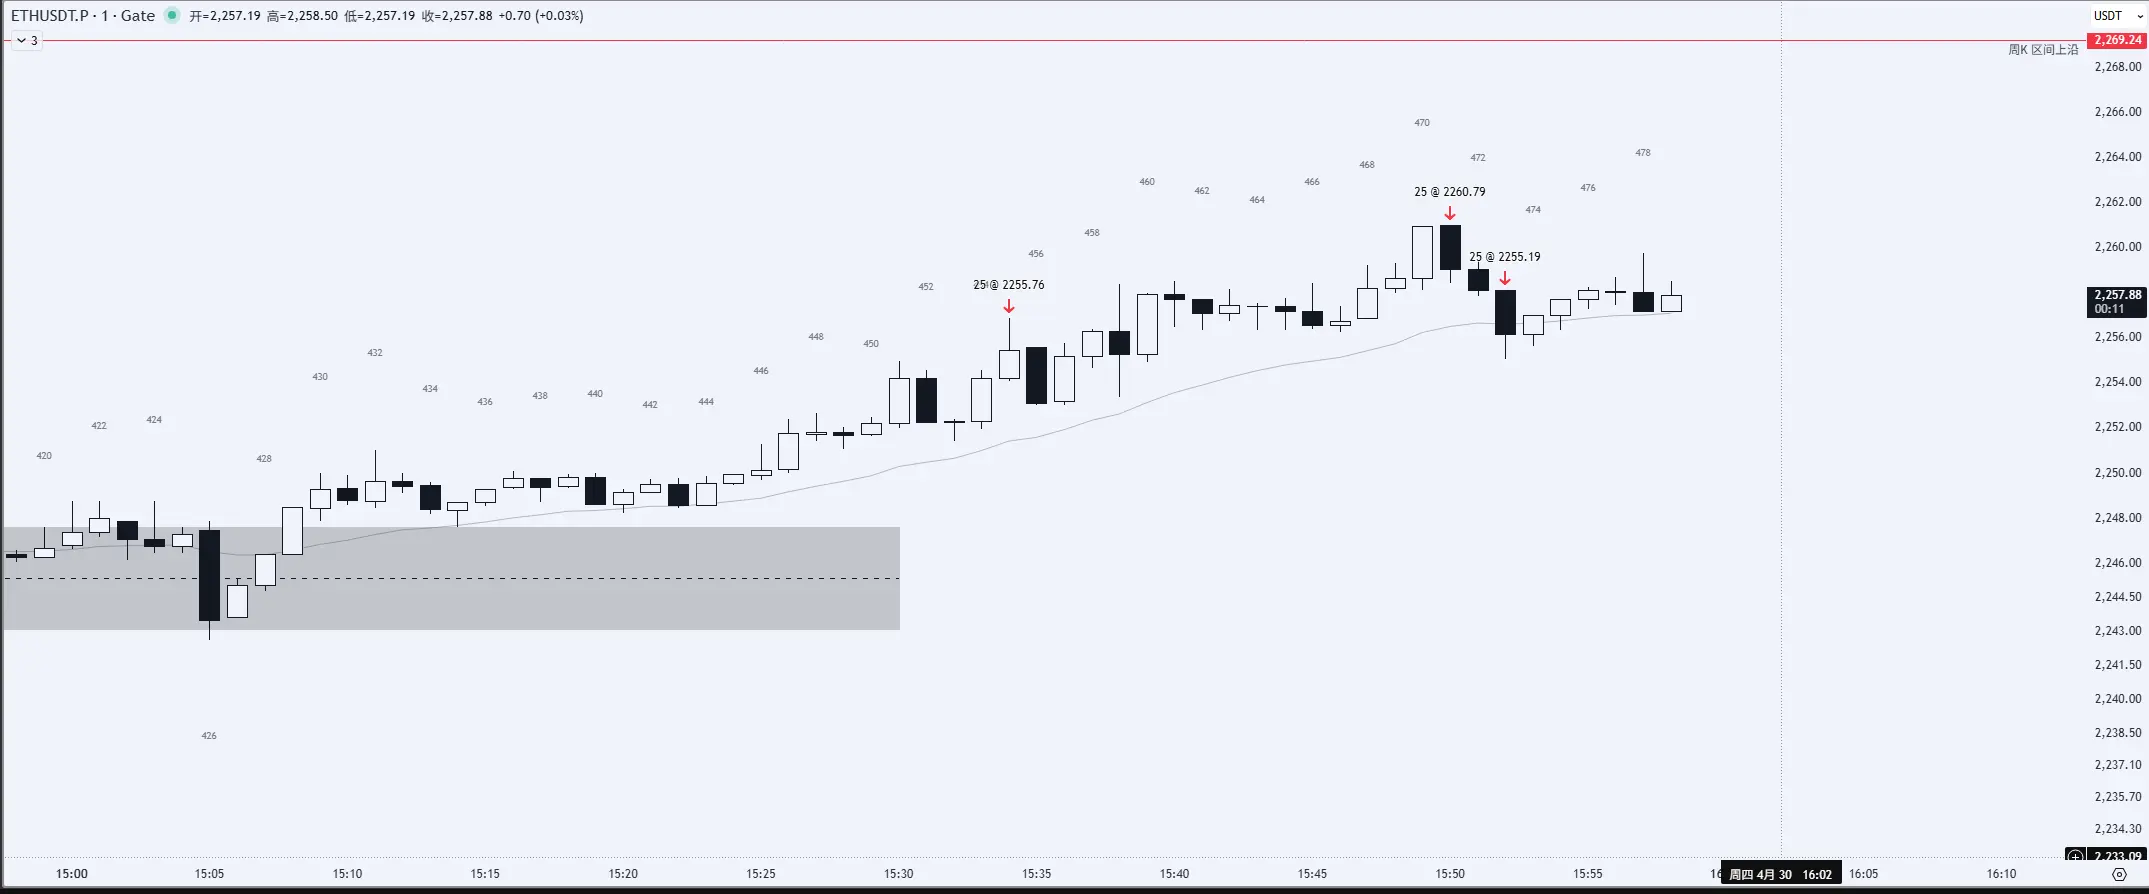
April 30, 2026 16:00
📊 Trade Review: ETH Price Action Analysis and Position Management This is a typical high-probability trend continuation trade. Based on Al Brooks' theory, we do not predict the market; we only read the candlesticks.
1️⃣ [Page Analysis - Key Highlights]
· Entry Bar 80 (Long Entry): On the 5-minute chart, Bar 80 shows an effective breakout above the previous oscillation range's upper limit. The price is supported above the 20-period EMA and closes at a high, demonstrating strong buying momentum.
· Exit Bars 91 & 95 (Profit Taking): Bar 91 is the first partial sell, fo
ETH-1.24%
View Original
post-image
post-image
  • Reward
  • Comment
  • Repost
  • Share
ETH Deep Structure Breakdown: Is the Bottom Rising or Is the Rebound Weak?
ETH has recovered after touching strong support at $2,251.00, with a maximum rebound to $2,346.11. Currently, the price has fallen back to around $2,315 and is consolidating, at a critical point for the 1-hour structure choice.
Bullish logic: Bottom rising, game of reversal structure support: The bottom at $2,251 shows clear volume-based stabilization signals, and the current correction has not broken the $2,300 threshold, indicating healthy higher lows formation. Moving average repair: Short-term moving averages are be
ETH-1.24%
View Original
  • Reward
  • Comment
  • Repost
  • Share
Load More

Join 40 M users in our growing community

⚡️ Join 40 M users in the crypto craze discussion
💬 Engage with your favorite top creators
👍 See what interests you
  • Pinned