EtherKai④

vip
On-chain Analyst
Futures Trading Strategist
Market Analyst
Together, grow well: Ethereum Kai A
Pin
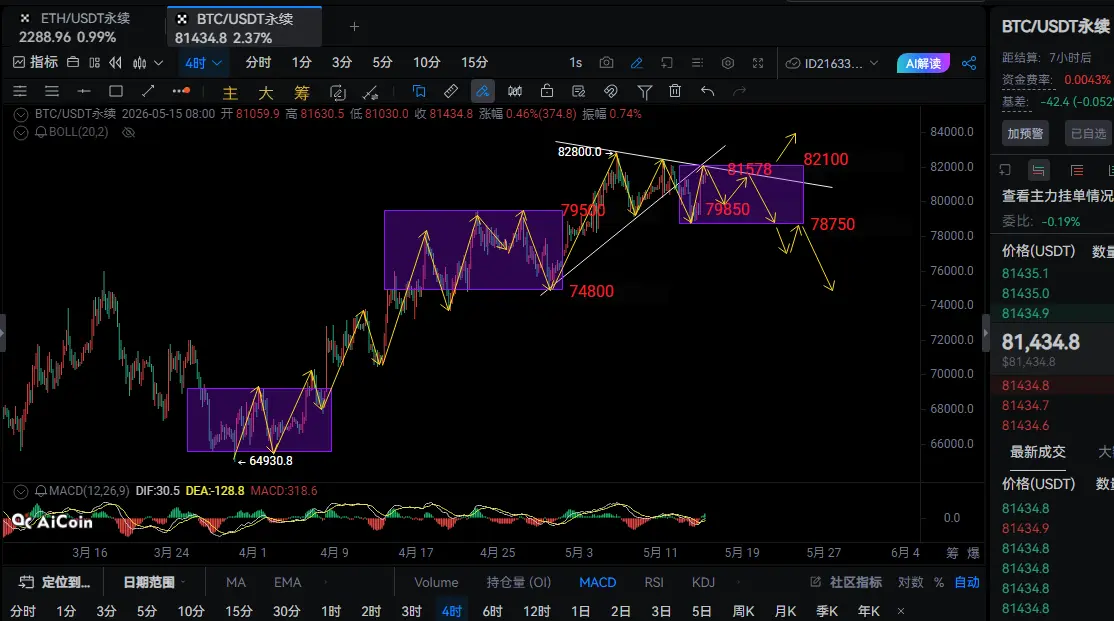
Bitcoin Market Analysis: The 4-hour timeframe shows the current price is in a high-level consolidation zone (78,750-82,100), which is the correction phase within an upward trend's central zone. The MACD indicator has a death cross above the zero line, with decreasing red bars, indicating diminishing bullish momentum and obvious short-term pullback pressure. As long as the intraday short-term support at 79,850 holds, the upward movement will continue to challenge 82,800; if it falls below 79,850, a deep correction will begin, with a move down to 78,750 or even lower.
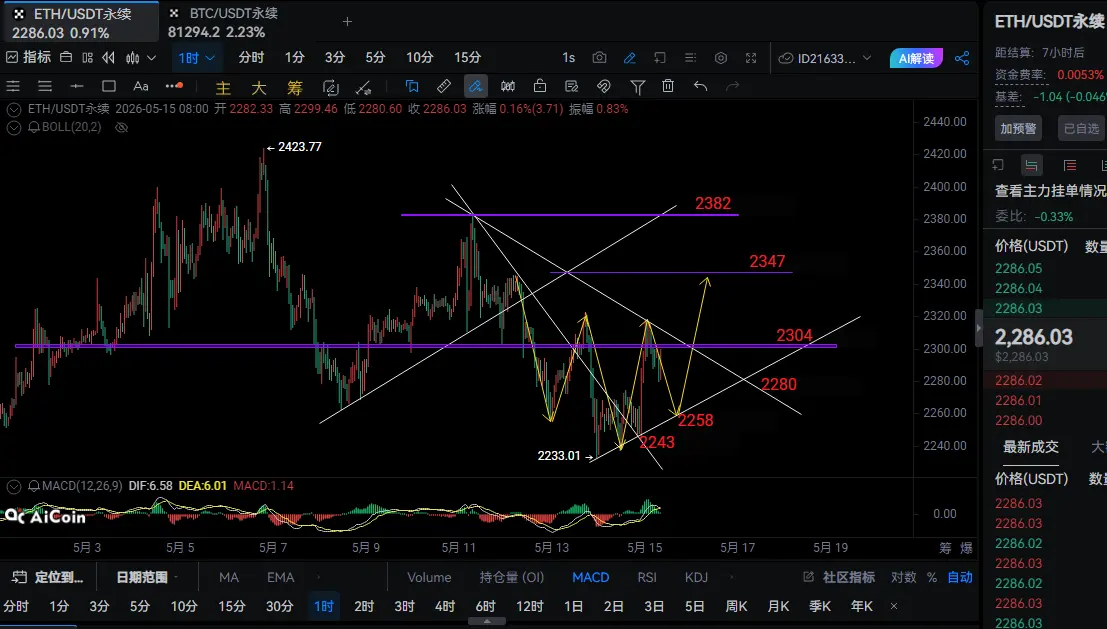
Ethereum Market Analysis: T
BTC-3.37%
ETH-4.43%
View Original
post-image
post-image
  • Reward
  • 1
  • Repost
  • Share
EtherKai④:
Qi
Goose🐧
4027
3836
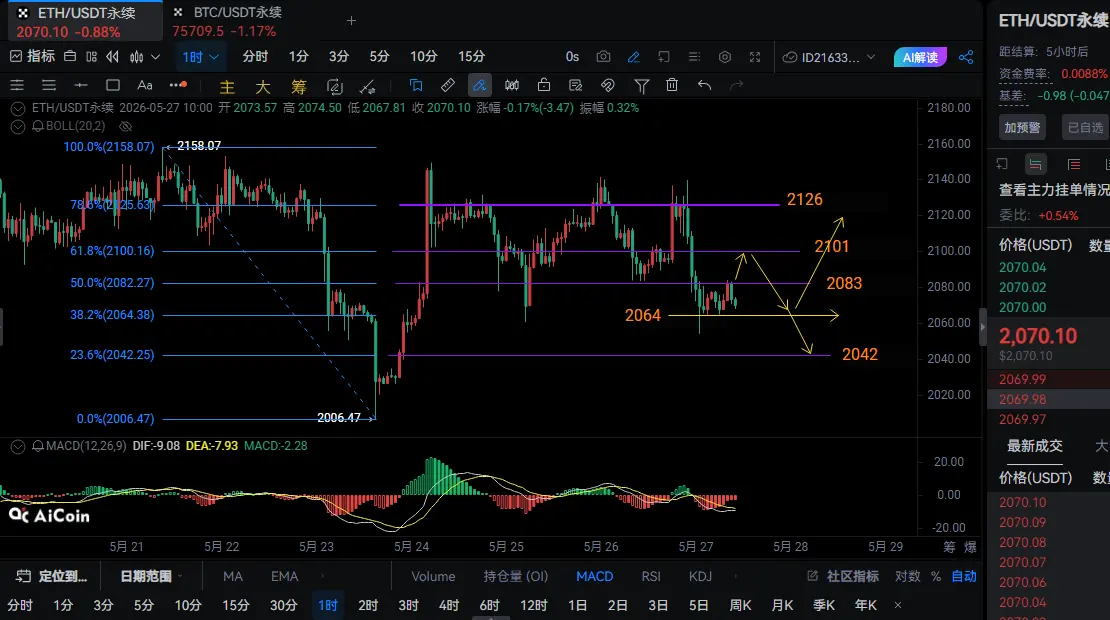
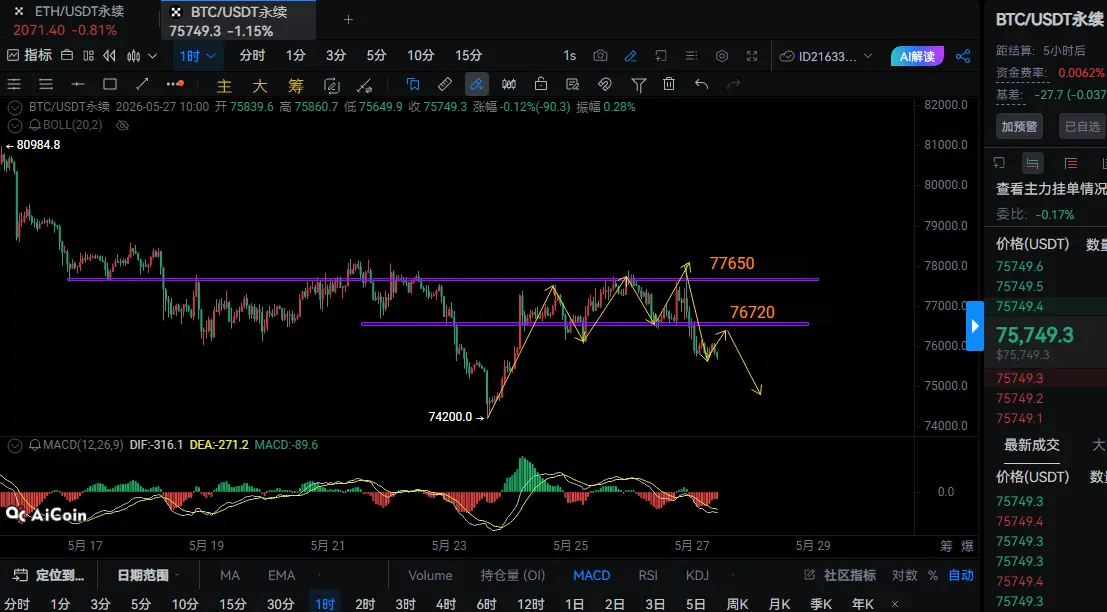
Bitcoin Market Analysis: On the 1-hour timeframe, the current price is still in the second bottoming phase after the decline. Key support and resistance levels are clear, and bearish momentum remains dominant. The MACD indicator is below the zero line with a dead cross, and the green histogram is expanding, indicating that bearish momentum continues to strengthen. If the rebound fails to break through the 77650 resistance, it will continue to probe the prior low of 74200; if 74200 is broken, the downtrend will accelerate.
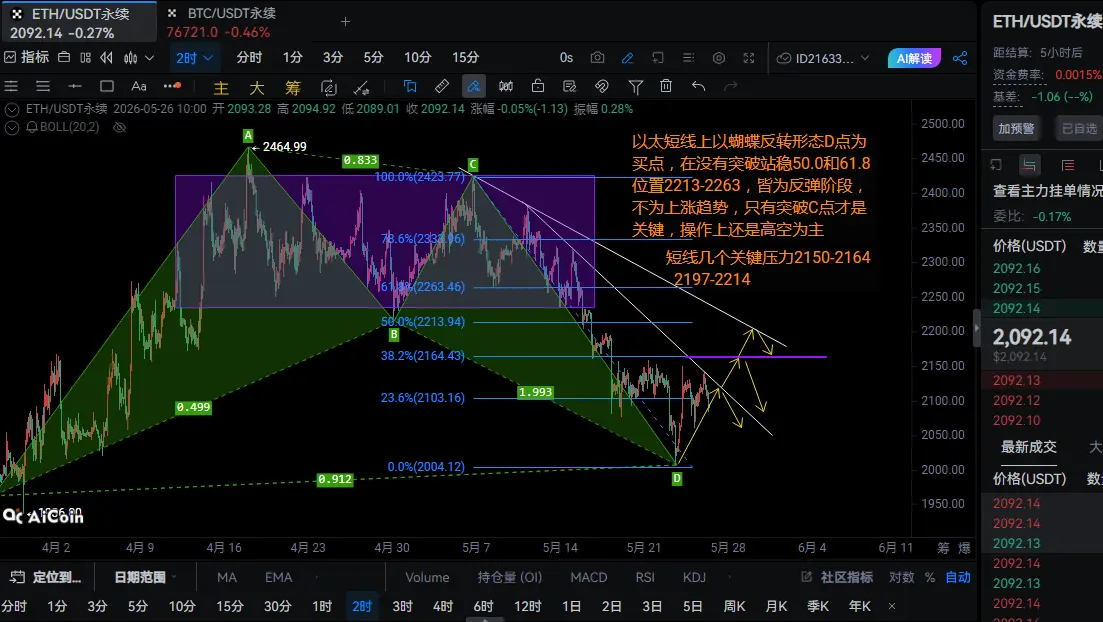
Ethereum Market Analysis: On the 1-hour timeframe, the trend is also in
BTC-3.37%
ETH-4.43%
View Original
post-image
post-image
  • Reward
  • Comment
  • Repost
  • Share
Bitcoin Market Analysis: The 1-hour timeframe shows the current price still in the second bottoming phase after a decline, with clear key support and resistance levels, and bearish momentum dominating. The MACD indicator is below the zero line with a dead cross, and the green histogram is expanding, indicating continued strengthening of the bearish momentum. If the rebound cannot break through the 77,650 resistance, the price will continue to test the previous low of 74,200; if it breaks below 74,200, the downtrend will accelerate.
Ethereum Market Analysis: The 1-hour trend is also in a downtr
BTC-3.37%
ETH-4.43%
View Original
post-image
post-image
  • Reward
  • Comment
  • Repost
  • Share
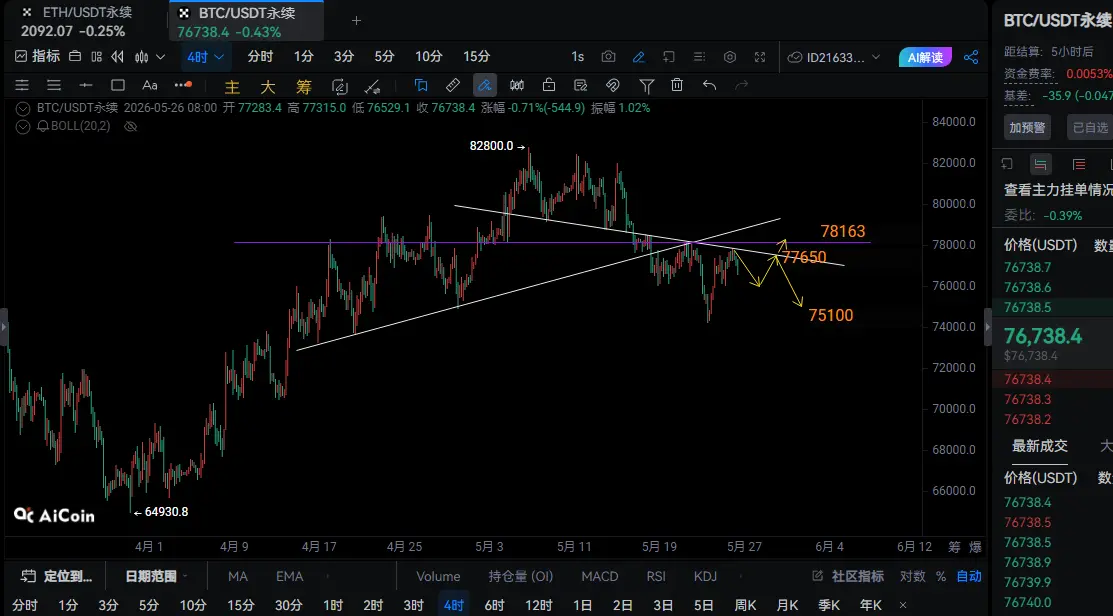
Bitcoin Market Analysis: The 4-hour level shows that the current price is in the stage of a rebound confirmation after breaking below the upward trend line, with clear key support and resistance. Technical analysis indicates that the price broke below the upward trend line, facing resistance during the rebound, and short-term bearish momentum still dominates. If the rebound cannot break through the 77,650-78,163 range, a second decline will be triggered, with the target directly at 75,100; if the trend line resistance is broken, the downward structure fails, and the trend shifts back to sidewa
BTC-3.37%
ETH-4.43%
View Original
post-image
post-image
  • Reward
  • Comment
  • Repost
  • Share
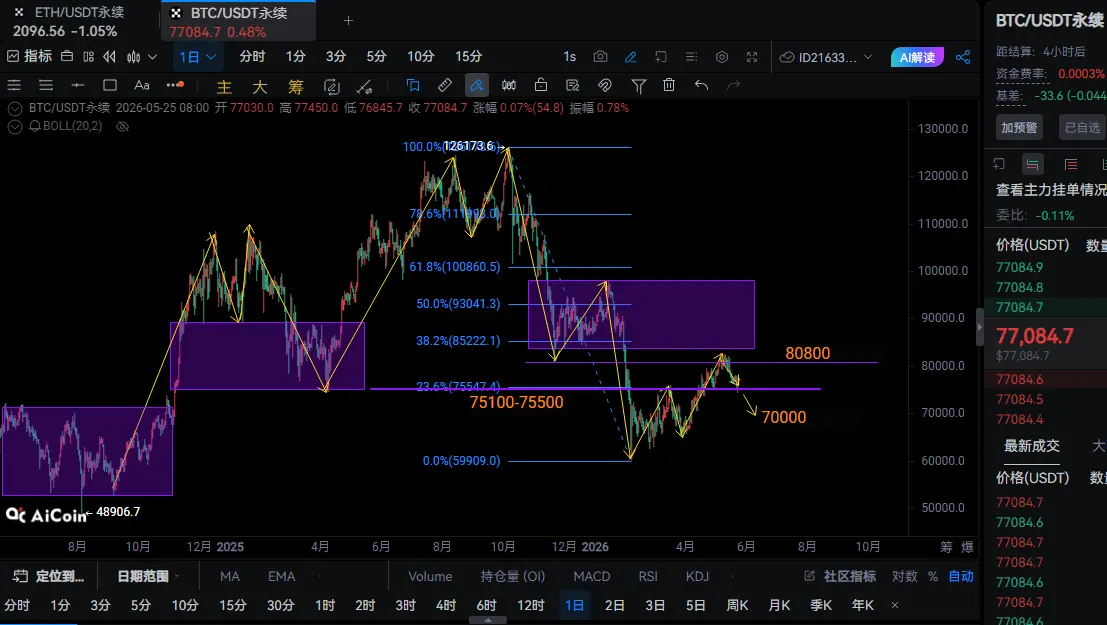
Bitcoin Market Analysis: The daily chart is currently in a rebound correction phase after a decline, operating near the support level. The long-term trend remains bearish. Based on recent movements, 82,800 is most likely the highest point in the near term. If it cannot break through this level and enter the C-center, the market will only move lower in the future.
All indicators show diminishing rebound momentum. As long as the short-term rebound does not break 80,800, it presents an opportunity to enter a medium- to long-term short position. If it falls below 75,100, the downward trend will ac
BTC-3.37%
ETH-4.43%
View Original
post-image
post-image
  • Reward
  • Comment
  • Repost
  • Share
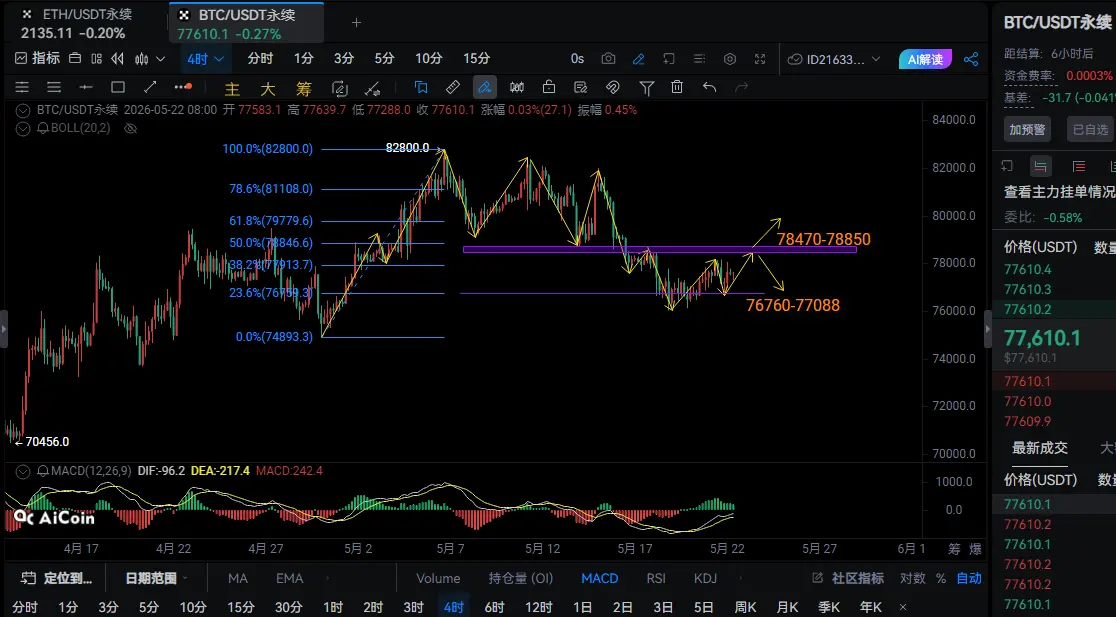
Bitcoin Market Analysis: The 4-hour level shows the current price is in a rebound correction phase after a decline. The key support and resistance levels are clear, making it a crucial node for short-term direction, but the overall long-term bearish trend has not changed.
Support level: 76,760-77,088 (rebound low support)
Resistance level: 78,470-78,850 (Fibonacci 50.0% key resistance)
As long as the price stays above the 76,760-77,088 support, it will continue to rebound. Currently, the price is fluctuating within the 76,000-78,200 range, with no clear short-term direction. The suggested stra
BTC-3.37%
ETH-4.43%
View Original
post-image
post-image
  • Reward
  • Comment
  • Repost
  • Share
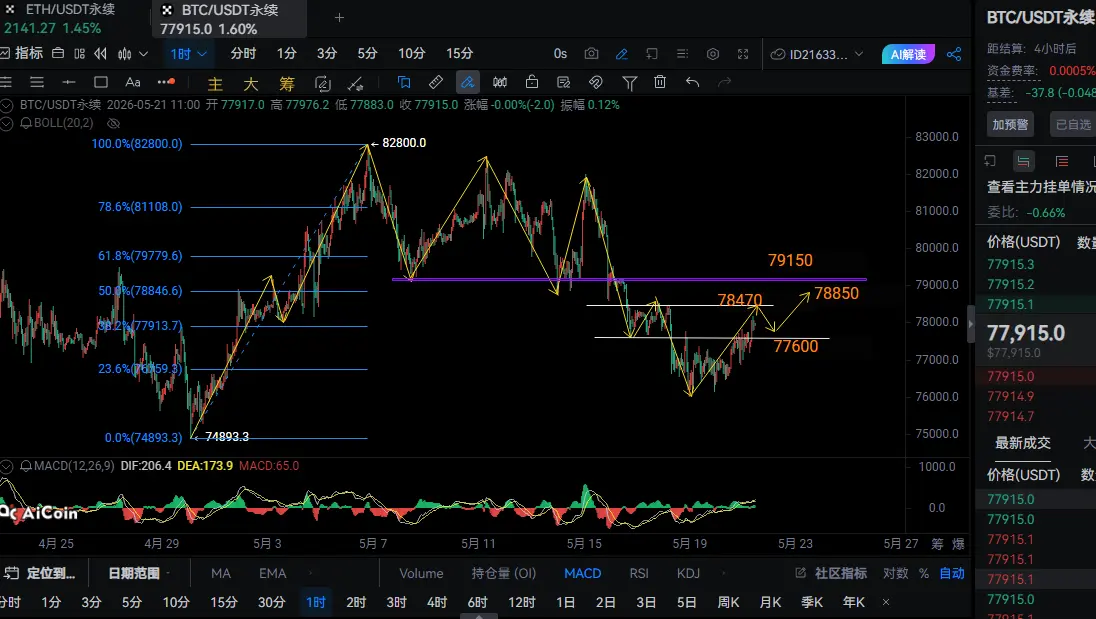
Bitcoin Market Analysis: The current price on the 1-hour chart is in the rebound phase within the Fibonacci retracement structure. The current price is trading above key support levels, indicating a bullish trend. Support levels are at 77,600 (short-term rebound low) and 78,470 (Fibonacci support / lower edge of the platform).
Resistance levels are at 78,850-79,150 (upper edge of the platform) and 81,108 (Fibonacci 78.6% resistance). As long as the price stays above 77,100 support in the short term, it will continue to rebound toward the 78,850-79,150 resistance zone. If it breaks below 77,1
BTC-3.37%
ETH-4.43%
View Original
post-image
post-image
post-image
  • Reward
  • Comment
  • Repost
  • Share
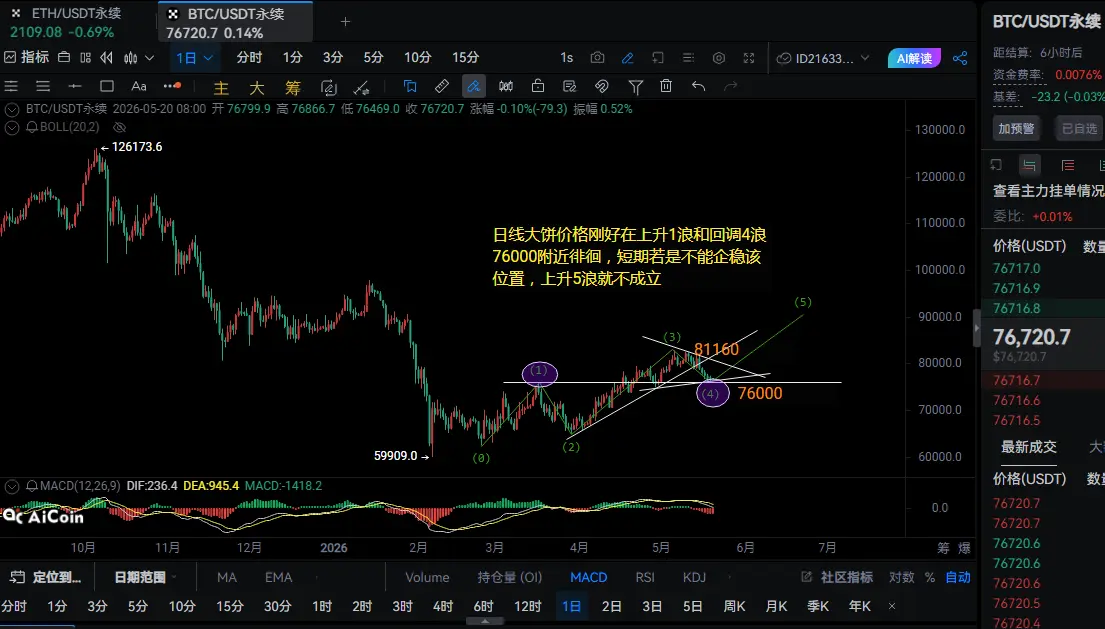
Bitcoin Market Analysis: The daily chart shows that the current price is in the fourth wave correction stage of an upward five-wave structure, with the key level at 76,000. The critical support level: 76,000 (the key support for the fourth wave correction, the lifeline for the upward five-wave to be established).
The MACD indicator has a death cross above the zero line, with decreasing red bars, indicating obvious short-term correction pressure. Only if it stabilizes above 76,000 can the upward five-wave be confirmed, which will then push towards 81,160 and challenge new highs; if it falls b
BTC-3.37%
ETH-4.43%
View Original
post-image
post-image
  • Reward
  • Comment
  • Repost
  • Share
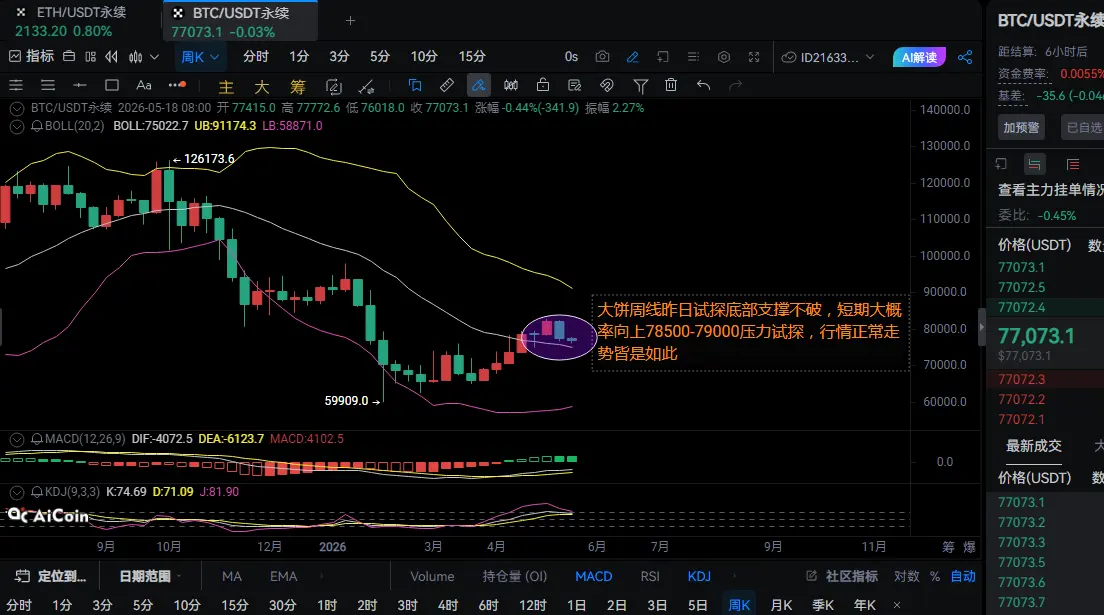
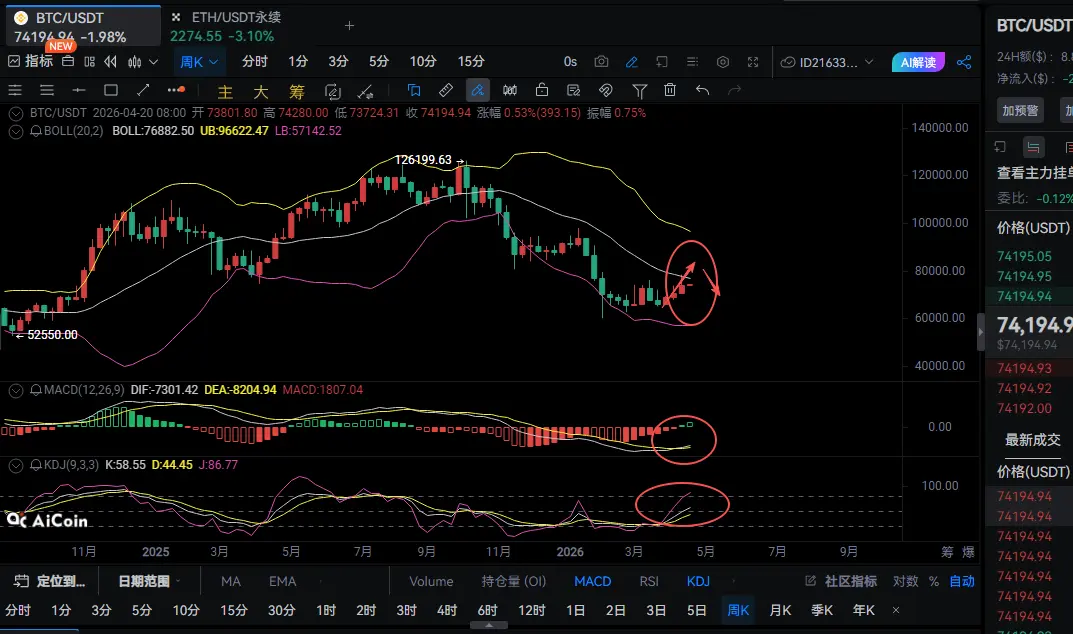
Bitcoin Market Analysis: On the weekly chart, the price yesterday approached the bottom support level without breaking it, and there are signs of stabilization at the bottom support level, indicating a high probability of a short-term rebound. If it can break through the short-term resistance of 78,500-79,000, the bearish trend may have the hope of reversing.
The MACD indicator's green bars are shrinking, and the KDJ indicator is turning upward, indicating diminishing bearish momentum. The short-term outlook is likely to test upward, and it still belongs to a normal rebound after a decline.
BTC-3.37%
ETH-4.43%
View Original
post-image
  • Reward
  • Comment
  • Repost
  • Share
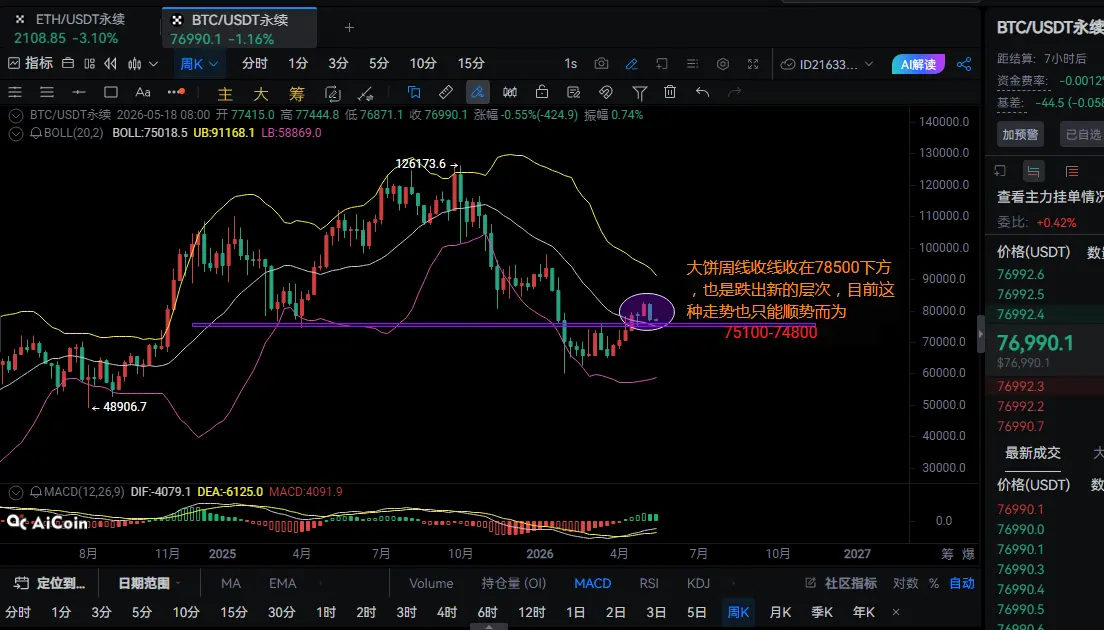
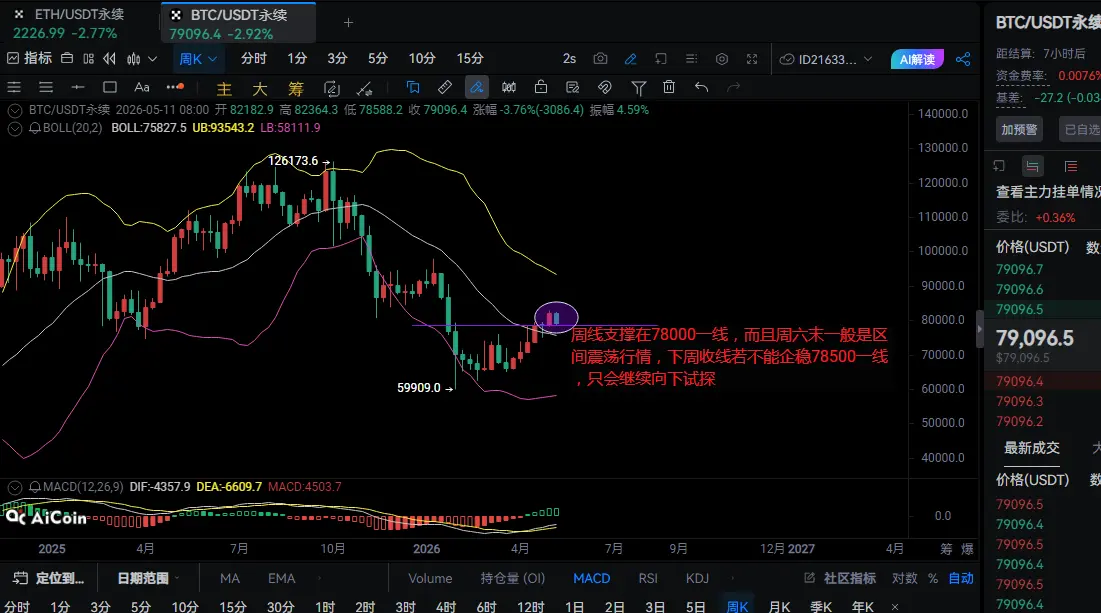
Bitcoin Market Analysis: The weekly chart shows the current price breaking below the key support level of 78,000, entering a new level, with an obvious weakening trend.
The MACD indicator's green bars are expanding, and the bearish momentum continues to strengthen; the price has broken below the midline of the weekly chart, and the Bollinger Bands are opening downward, confirming a medium-term downtrend.
Trading should mainly follow the trend and consider short positions.
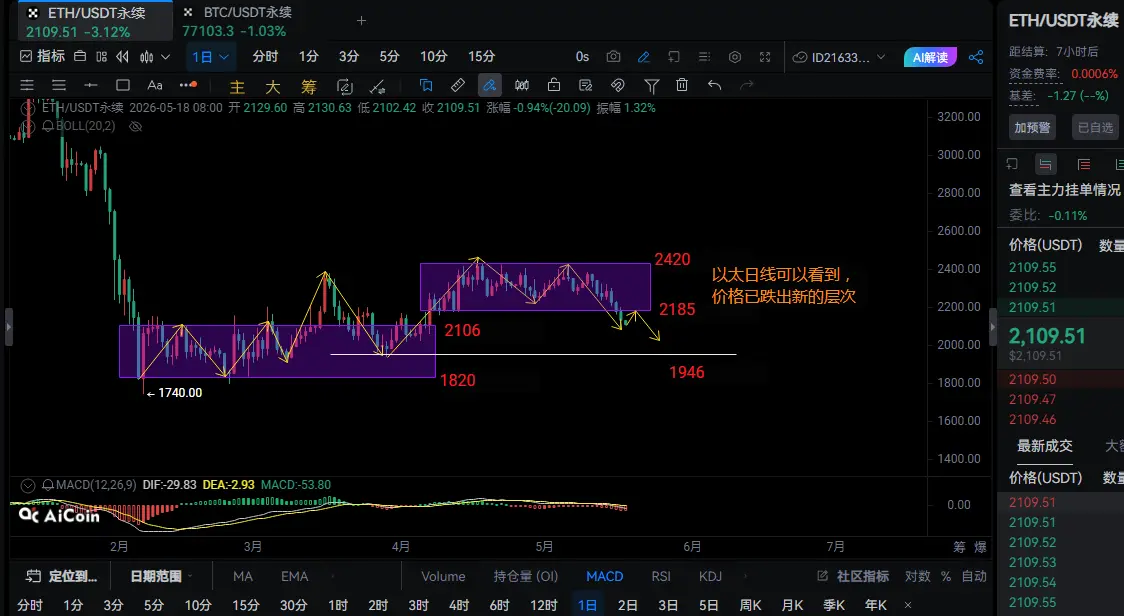
Ethereum Market Analysis: On the daily chart, the current price has broken below the previous oscillation zone lower bo
BTC-3.35%
ETH-4.41%
View Original
post-image
post-image
  • Reward
  • Comment
  • Repost
  • Share
Bitcoin Market Analysis: On the weekly chart, the current price around 78,000 is supported, at a critical decision point. The weekly MACD indicator's green bars are continuously shrinking, indicating diminishing bearish momentum, but it has not fully turned bullish. If it cannot stabilize above 78,500 this week, it will continue to test support levels downward; if it holds the support and closes above it, the weekly trend may turn bullish, resuming a rebound.
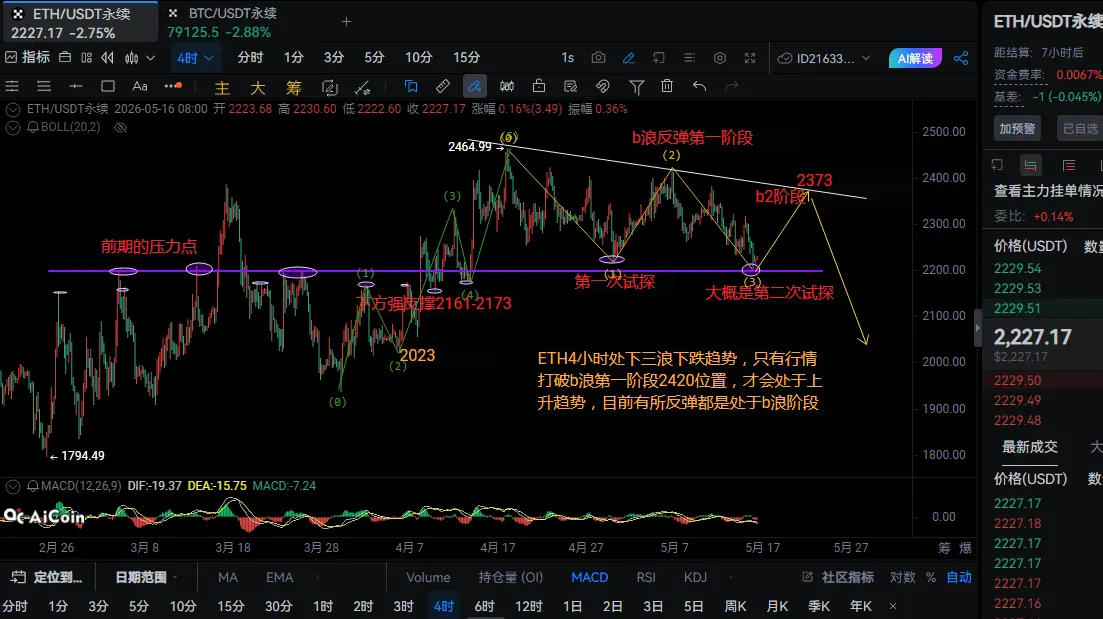
Ethereum Market Analysis: On the 4-hour chart, the current price is in the B wave rebound phase of a three-wave downtrend. The current r
BTC-3.37%
ETH-4.43%
View Original
post-image
post-image
  • Reward
  • Comment
  • Repost
  • Share
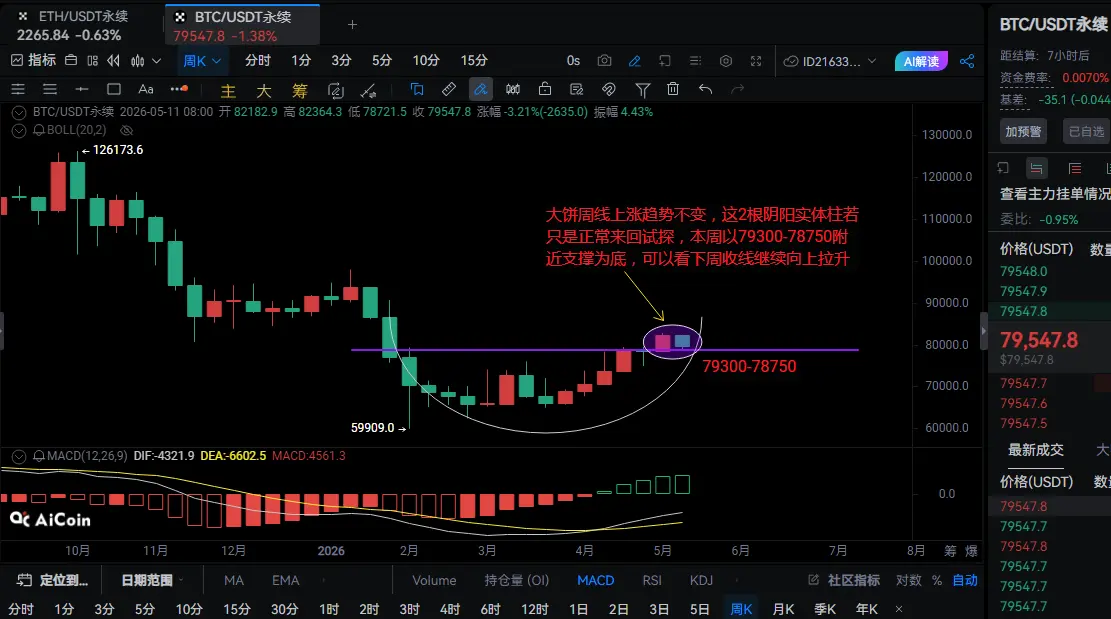
Bitcoin Market Analysis: On the weekly level, the current upward trend is clear, with prices staying above the key support zone of 79,300-78,750, which is a normal retracement test during an upward move.
79,300-78,750 (weekly strong support, trend lifeline)
Resistance at 81,300 (short-term rebound resistance). As long as this week’s support at 79,300-78,750 holds, the weekly chart is likely to continue upward next week; if it breaks below this range, the weekly trend weakens, and the correction deepens.
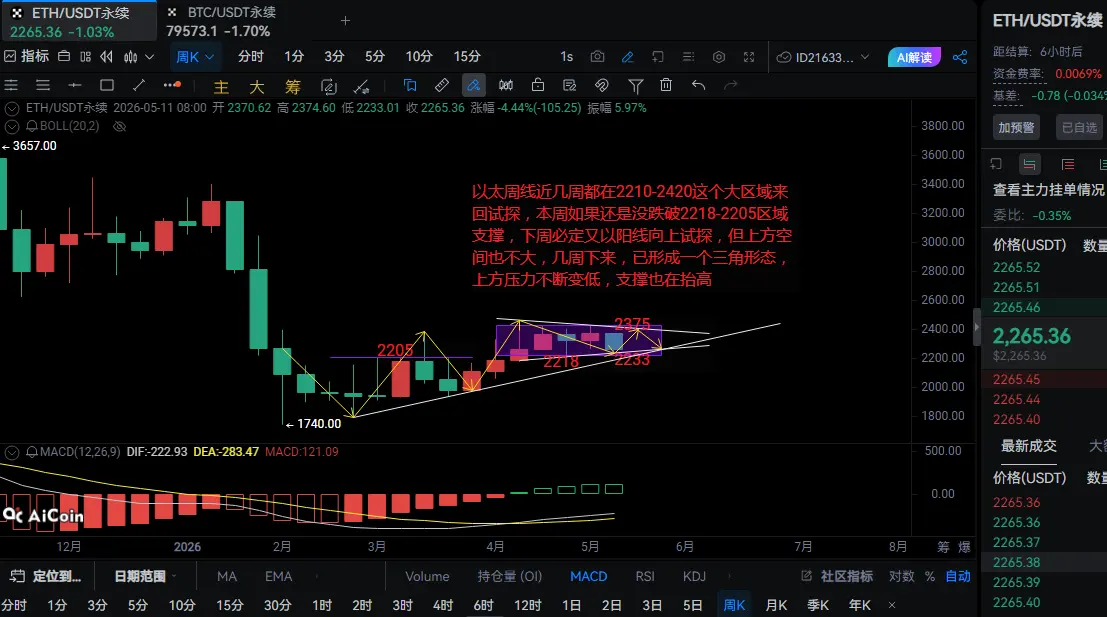
Ethereum Market Analysis: In recent weeks on the weekly level, prices have been testi
View Original
post-image
post-image
  • Reward
  • Comment
  • Repost
  • Share
Bitcoin Market Analysis: The daily chart shows that the current price is still in an upward trend. There are two key support levels below: 73,800 and 76,000. Although the short-term rally has encountered resistance and pulled back, it is in a phase of direction selection. The MACD indicator shows the red histogram shrinking, indicating diminishing bullish momentum and obvious short-term correction pressure; if the 76,000 support holds, the rebound will continue to push higher.
Ethereum Market Analysis: The 1-hour chart indicates that the current price is in a correction phase after a period of
BTC-3.37%
ETH-4.43%
View Original
post-image
  • Reward
  • Comment
  • Repost
  • Share
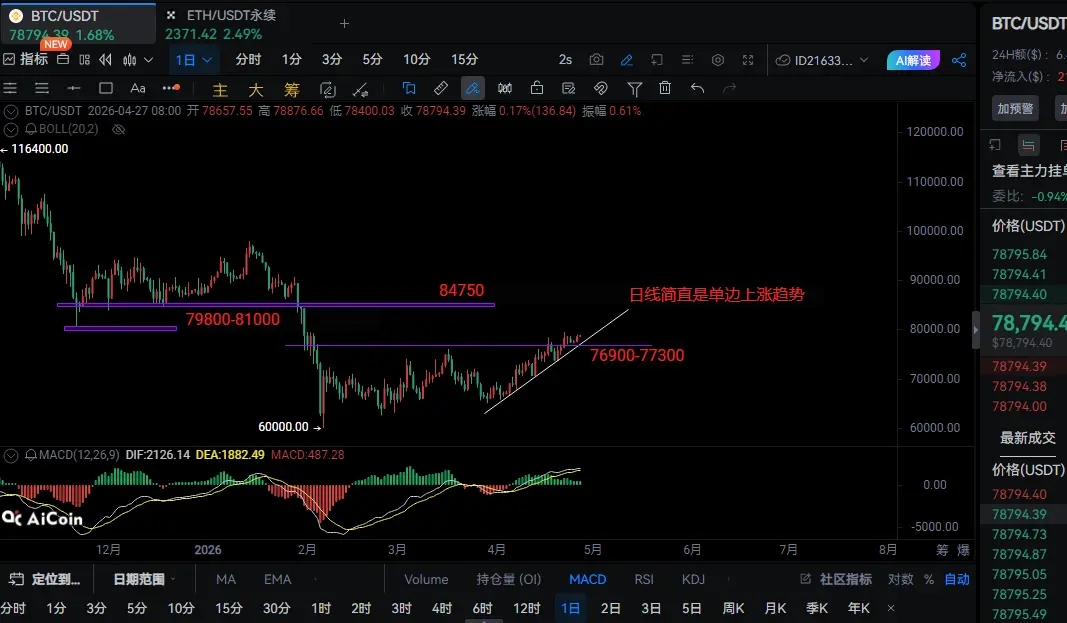
Big Cake Market Analysis: From the daily chart level, the current price is showing a one-way upward trend. The price is steadily climbing along the rising trendline, and the bullish momentum is strong. The MACD indicator continues to form a bullish crossover above the zero line, with the red bars expanding in volume—confirming that the bullish trend remains intact. As long as the support at 76,900-77,300 holds, the one-way rally will continue, pushing toward the 79,800-81,000 range; after a breakout, the target directly points to 84,750.
Ethereum Market Analysis: On the 1-hour chart, the curre
BTC-3.37%
ETH-4.43%
View Original
post-image
post-image
post-image
  • Reward
  • Comment
  • Repost
  • Share
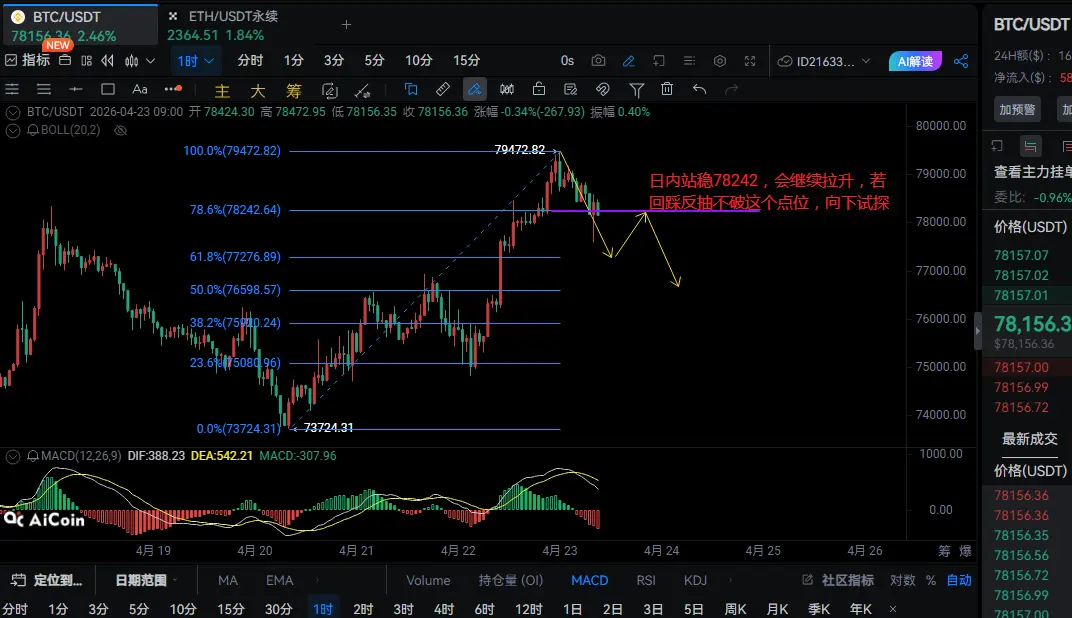
Bitcoin Market Analysis: From the 1-hour timeframe, the current price is in a retracement confirmation stage after reaching a high,
78242 is a key trend level, 77276 (Fibonacci 61.8% strong support), MACD indicator shows a death cross above the zero line, red bars shrinking, bullish momentum weakening;
If the price can hold above 78242 during the intraday, it will continue to rise and challenge the previous high;
If it retraces and rebounds without breaking this level, it will test support downward.
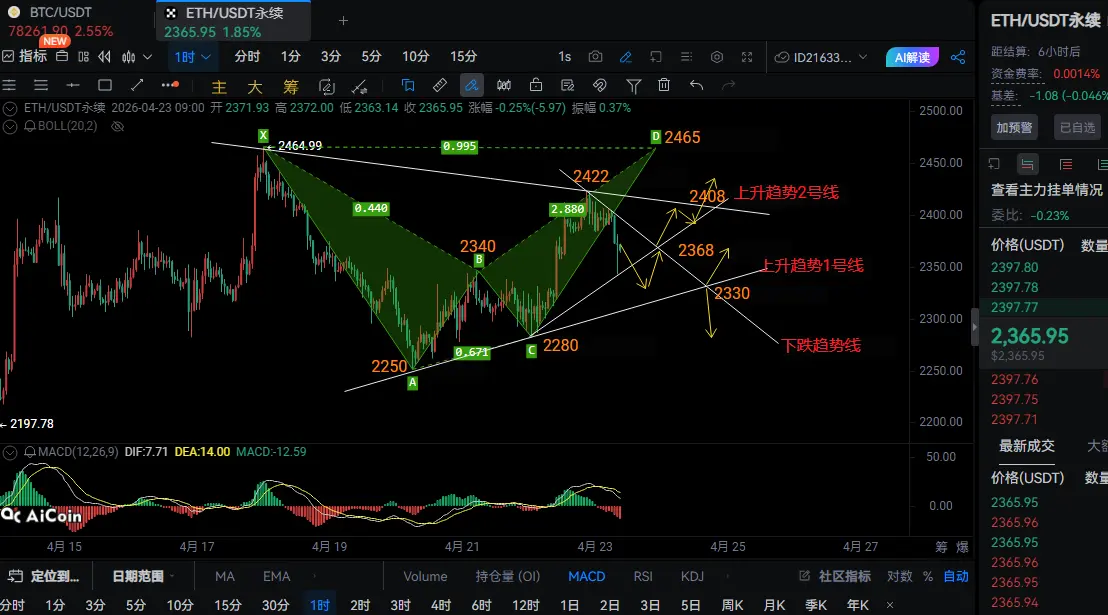
Ethereum Market Analysis: From the 1-hour timeframe, the current price is in an ascending
BTC-3.37%
ETH-4.43%
View Original
post-image
post-image
  • Reward
  • Comment
  • Repost
  • Share
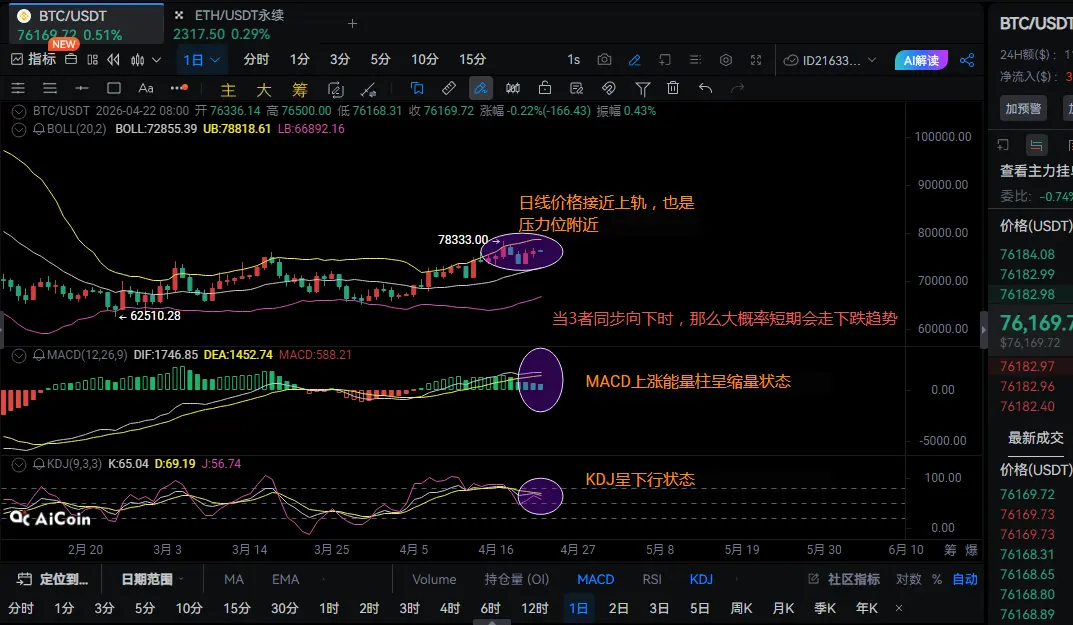
Big Cake market analysis: From the daily level, the current price has already approached the upper band of the Bollinger Bands and is near the 78,333 prior high resistance level, and bullish momentum has started to weaken. Key support is 74,600,
Resistance at 76,880. The MACD red bars are shrinking, the KDJ indicator is turning downward, and an adjustment signal appears near the upper Bollinger Band. If all three move downward in sync, the probability of a short-term pullback increases.
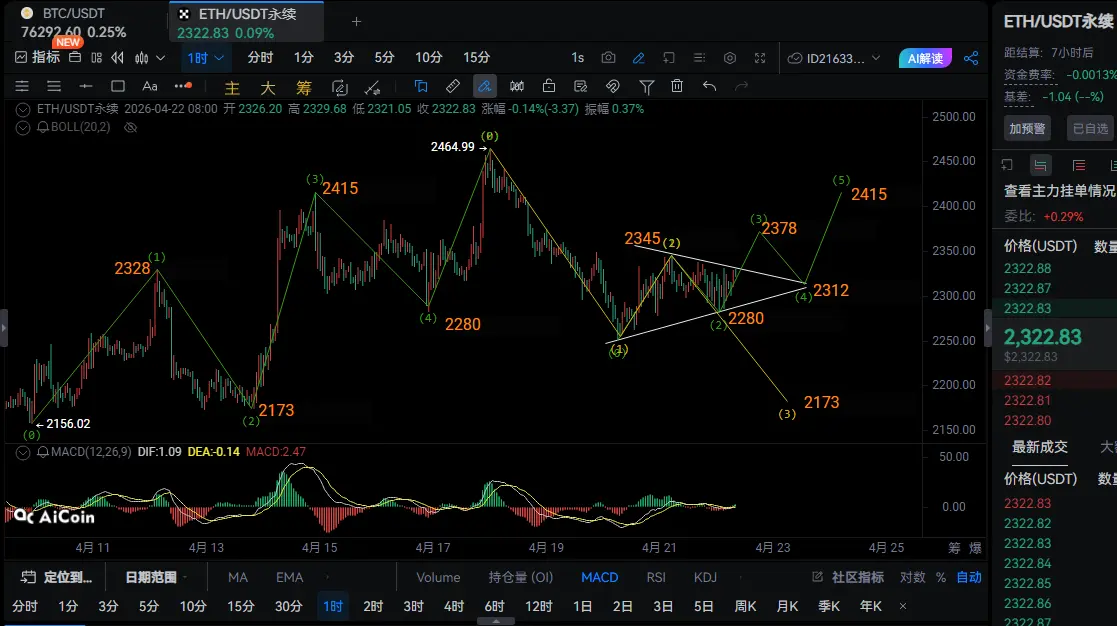
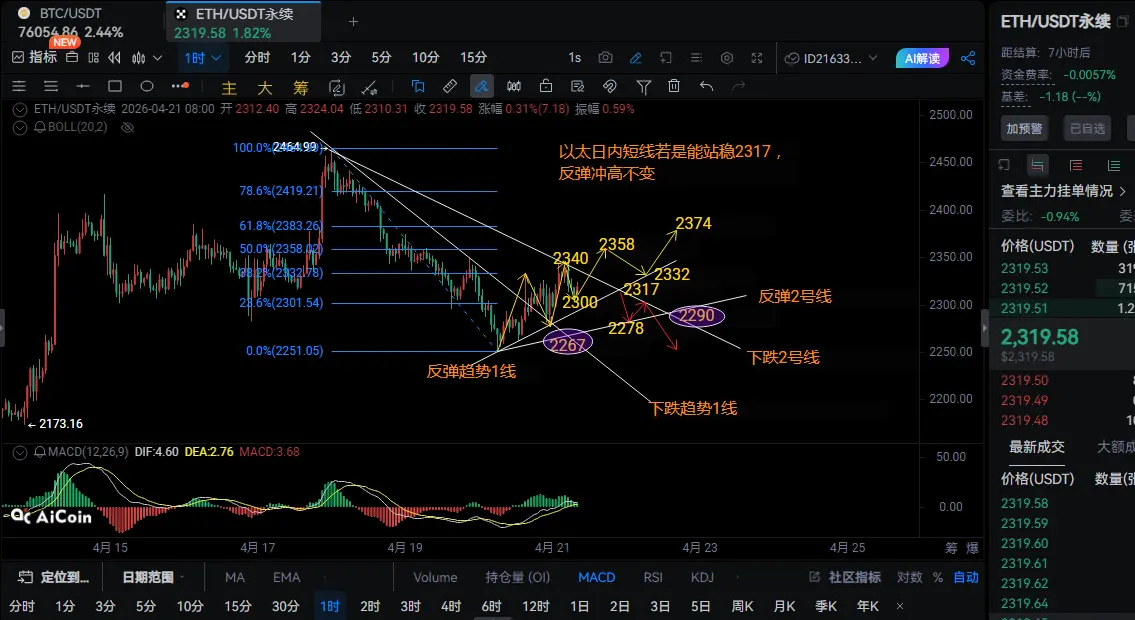
Ethereum market analysis: From the 1-hour level, the current price is in an ascending wedge consolidation.
BTC-3.37%
ETH-4.43%
View Original
post-image
post-image
  • Reward
  • Comment
  • Repost
  • Share
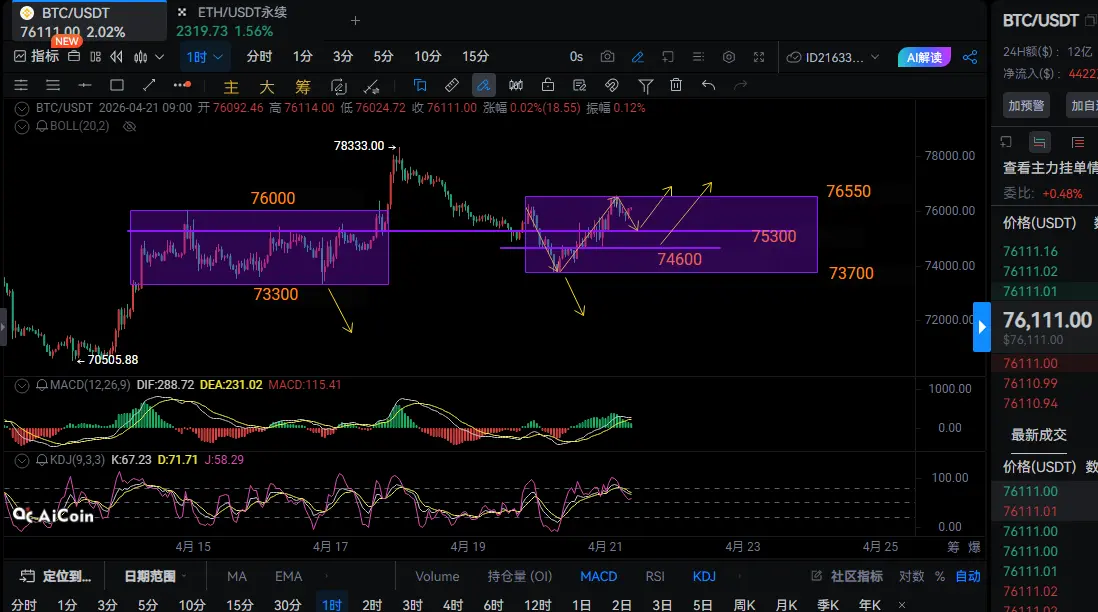
Bitcoin Market Analysis: 1-hour timeframe current price is consolidating in the 74,600-76,550 range, continuing the previous bullish trend, and is currently trading in the upper part of the range. The MACD indicator is above the zero line and has a golden cross; the red histogram is modestly expanding, indicating sufficient bullish momentum. The KDJ is in a neutral-to-bullish range—as long as the 74,600 support is held, the rebound will continue, pushing toward 76,550 and challenging the previous high. If it breaks below 74,600, it will move down to test the 73,700 support, and the pullback wi
BTC-3.37%
ETH-4.43%
View Original
post-image
post-image
  • Reward
  • Comment
  • Repost
  • Share
Bitcoin Market Analysis: Weekly chart—current price is near the middle band of the Bollinger Bands, the rebound trend at the weekly level is intact, and it is currently in the pullback confirmation stage. Key support is 73200, resistance is 76100,
The MACD indicator is forming a golden cross below the zero line, the red histogram continues to expand, and bullish momentum is gradually strengthening; KDJ is crossing upward, and the medium-term uptrend is clear. As long as 73200 support is held, the rebound will continue to challenge the previous high; if the weekly trend weakens after a break,
BTC-3.37%
ETH-4.43%
View Original
post-image
post-image
  • Reward
  • Comment
  • Repost
  • Share
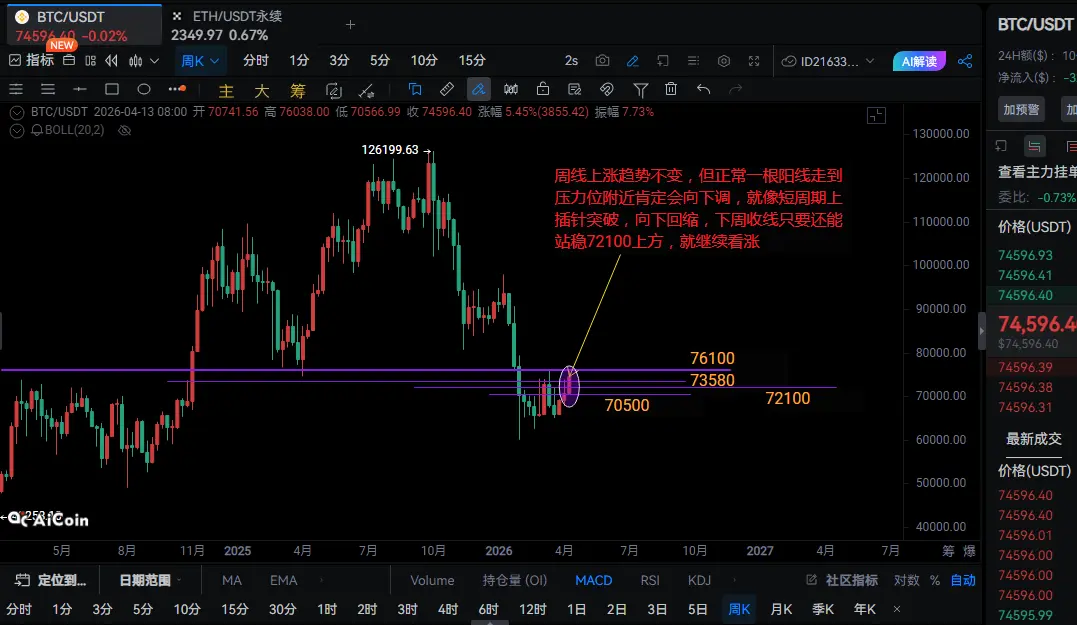
Bing Bing Market Analysis: The current upward trend on the weekly chart remains unchanged, but there is a pin-bar breakout followed by a pullback confirmation action within the resistance range of 76,100-73,580. As long as next week's weekly candle closes and holds above 72,100, the upward trend will continue, pushing toward 76,100; if it breaks below 72,100, the short-term correction will deepen, with a move down to 70,500.
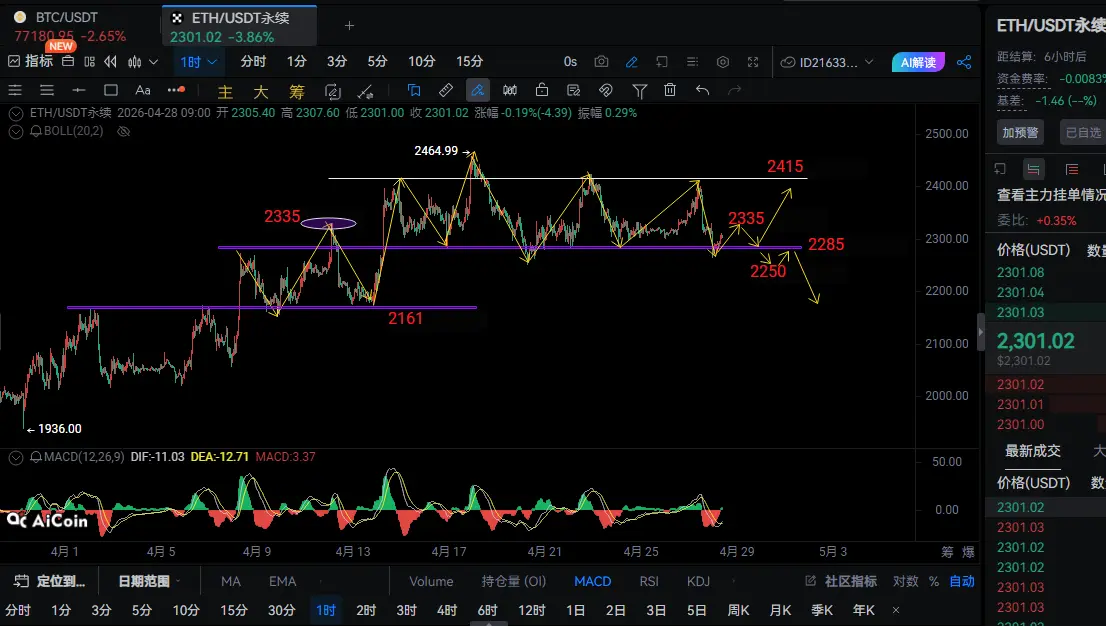
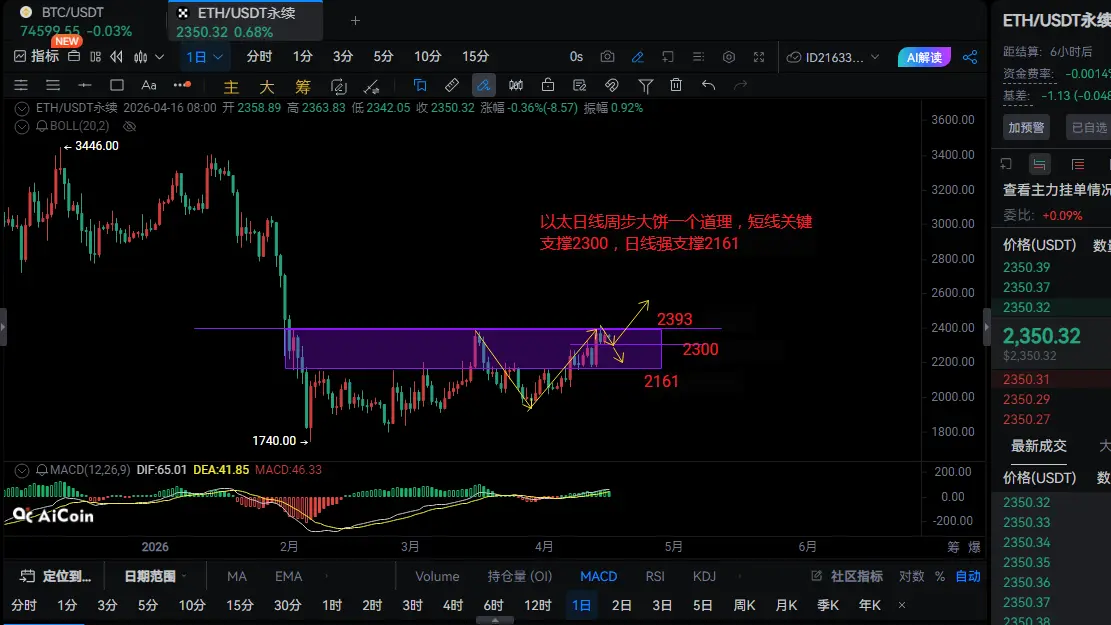
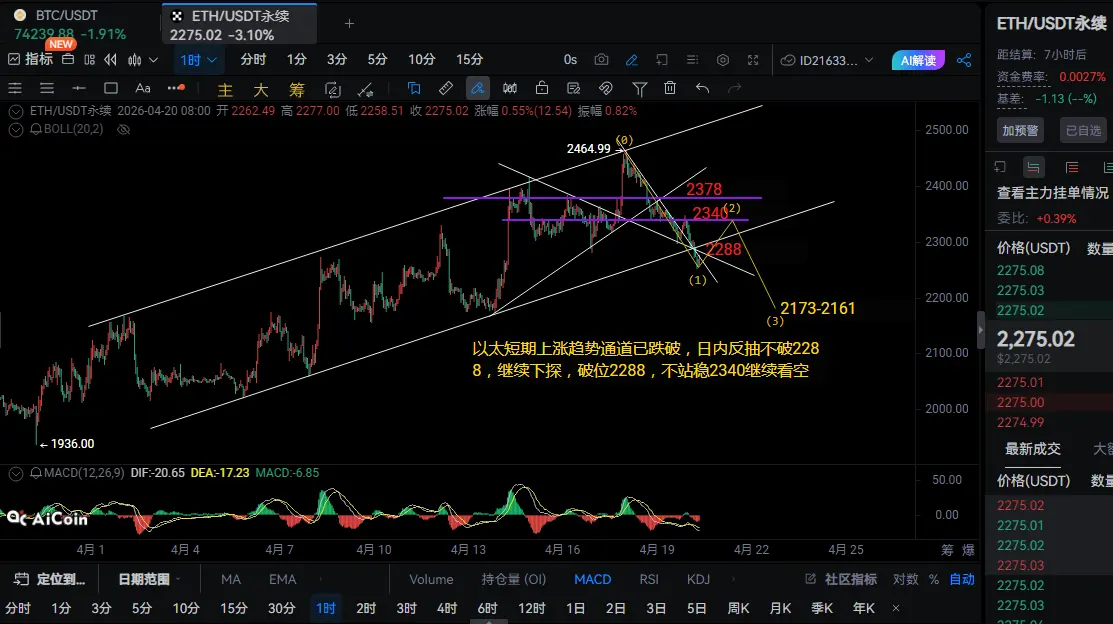
Ether Market Analysis: The current outlook on the daily chart is in sync with Bing Bing; the key short-term support is 2,300, the strong daily support is 2,161, and short-
BTC-3.37%
ETH-4.43%
View Original
post-image
post-image
  • Reward
  • Comment
  • Repost
  • Share
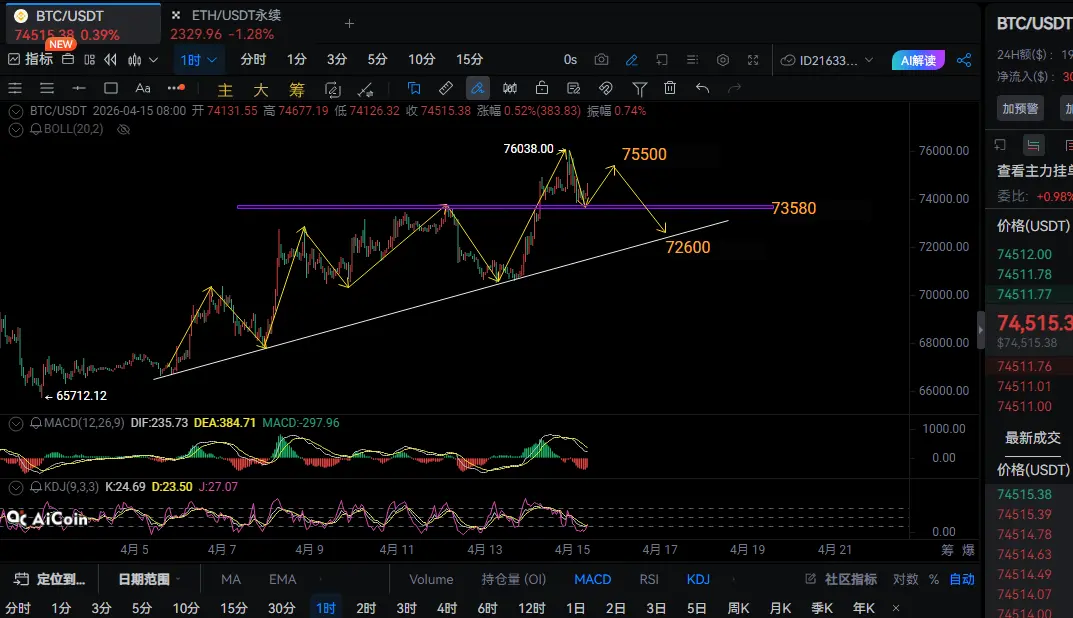
Bitcoin Market Analysis: The 1-hour current price is trading above the upward trend line, in a retracement phase after the previous high of 76,038, with clear short-term support. The MACD indicator shows a death cross above the zero line, with increasing green bars, indicating obvious short-term retracement pressure; as long as the 73,580 support is maintained, the rebound will continue, aiming for 75,500 and challenging the previous high; if the 73,580 support is effectively broken, the price will drop to 72,600, and a trend line break would deepen the correction.
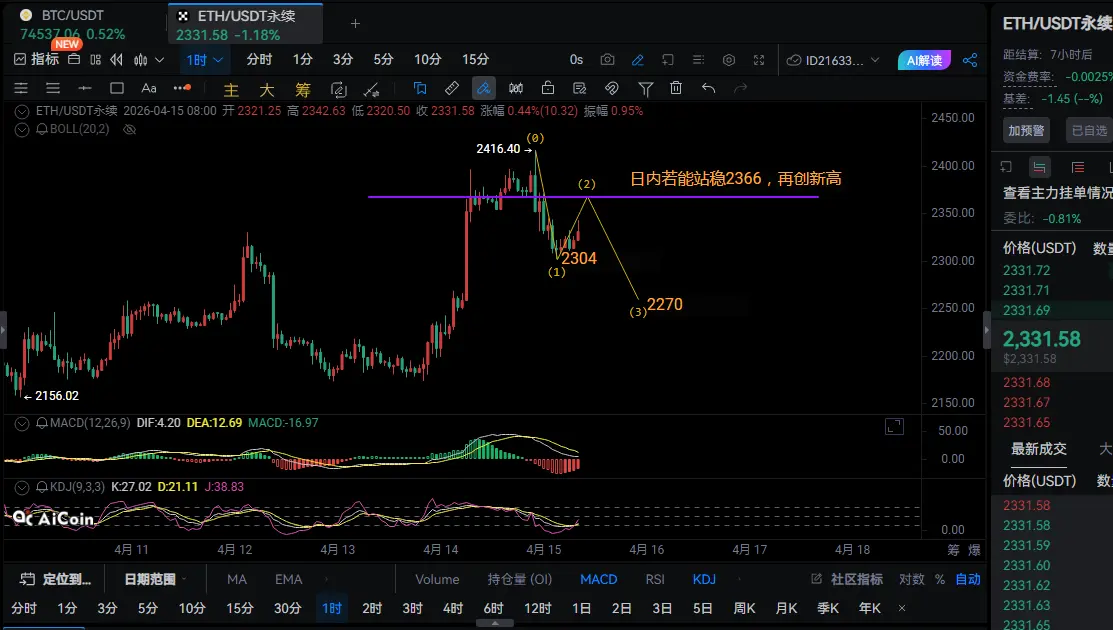
Ethereum Market Analysis: Th
BTC-3.37%
ETH-4.43%
View Original
post-image
post-image
  • Reward
  • Comment
  • Repost
  • Share
  • Pinned