

#TradFi交易分享挑战
# Trading CFD to Receive Gold
Today’s Gold Market Analysis
Core Market Trends
Intraday Trajectory:
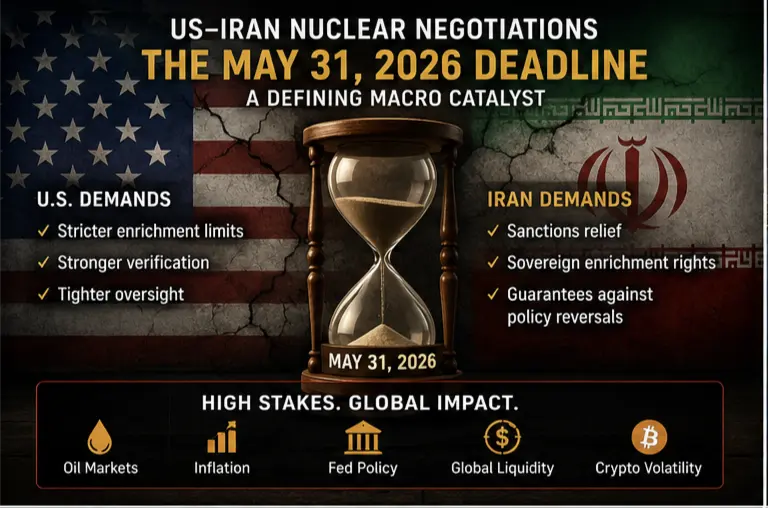
Asian session fluctuated upward from $4536, reaching a high of $4552 ( +0.35% ), influenced by news of progress in US-Iran talks.
Currently trading in the $4532.96–$4579.86/ounce range, a slight increase of 0.3% from the previous close of $4536, showing a tug-of-war pattern of “geopolitical conflict easing + dollar suppression.”
Volume Characteristics:
COMEX gold futures main contract trading volume decreased by 18% year-over-year, with the market awaiting guidance from tonight’s Federal Reserve officials’ speeches.
Technical Indicators’ Bull-Bear Signal
Momentum Structure:
MACD(12,26): Histogram turns positive but slope remains flat (+0.82), fast and slow lines are clustered below zero, indicating an imminent decision.
RSI(14)=47.3: Neutral zone with weak oscillation, no signs of overbought/oversold pressure.
Bollinger Bands Converging: Channel narrows to $4520–$4570 (20-day minimum range), indicating a breakout is near.
Cycle Resonance:
Quarterly EMA(60)= $4500: Coincides with weekly cloud baseline, forming a strong support level.
Fibonacci Key Levels: Retraced from May high of $4577, with 38.2% at $4545 as the intraday center, and 61.8% at $4520 as the bullish line of defense.
Key Support and Resistance Levels
Bearish Fortress (Resistance):
$4560: 20-day moving average + May downtrend line resistance, breaking above opens space to $4600.
$4577: May 25 high, concentrated gamma resistance zone in options.
Bullish Barrier (Support):
$4520: Bollinger lower band + 61.8% Fibonacci retracement, the intraday dividing line between strength and weakness.
$4500: Quarterly moving average + central bank gold purchase cost anchor zone, with less than 10% probability of breaking below this ultimate defense.
Market Outlook: Triple-Drive Logic and Risk Warnings
▶️ Short-term Catalysts (24-48 hours)
Federal Reserve Policy Play:
If Fed Governor Waller signals a delay in rate cuts at 22:00 today (current 68% probability of a September cut), gold prices may dip back to $4520.
Conversely, if emphasizing recession risks, hedge funds’ short covering will push prices up to $4560.
Geopolitical Powder Keg:
Attacks on Red Sea shipping increase oil premiums; if conflict spreads to the Strait of Hormuz, gold will surge directly past $4600.
▶️ Medium-Long Term Structural Support
Central Bank Gold Buying Hegemony:
Global central banks net purchased 244 tons of gold in Q1 (+15% YoY), with China increasing holdings for 18 consecutive months, making $4500 a new value center.
Polish central bank announced an additional 100 tons by 2026; institutional models show central bank buying triggers below $4300.
Inflation Reversal Expectations:
US 5-year inflation expectations rose to 2.48% (New York Fed data), weakening real interest rate suppression.
⚠️ Downside Risk Alerts
Dollar Black Swan: If US Q1 GDP revision exceeds expectations (initial 3.1%), the dollar index may rally to 104, suppressing gold to $4480.
Algorithmic Trading Flash Crash: There are 2.7 million ounces of algorithmic sell orders below $4520, and technical breakdowns could trigger a 2% flash crash.
Trading Strategies:
Aggressive:
Buy lightly at $4545 with small positions, stop-loss at $4515 (0.7% tolerance for breakdown), target $4560→$4577.
Conservative:
If retesting $4520 and stabilizing, add positions, betting on central bank support, with a target of $4600 (about 6% upside).
Breakout Chase:
Volume breakout above $4577 to chase the rally, aiming for $4620 (March high + Gann angle resistance).
# Trading CFD to Receive Gold
Today’s Gold Market Analysis
Core Market Trends
Intraday Trajectory:
Asian session fluctuated upward from $4536, reaching a high of $4552 ( +0.35% ), influenced by news of progress in US-Iran talks.
Currently trading in the $4532.96–$4579.86/ounce range, a slight increase of 0.3% from the previous close of $4536, showing a tug-of-war pattern of “geopolitical conflict easing + dollar suppression.”
Volume Characteristics:
COMEX gold futures main contract trading volume decreased by 18% year-over-year, with the market awaiting guidance from tonight’s Federal Reserve officials’ speeches.
Technical Indicators’ Bull-Bear Signal
Momentum Structure:
MACD(12,26): Histogram turns positive but slope remains flat (+0.82), fast and slow lines are clustered below zero, indicating an imminent decision.
RSI(14)=47.3: Neutral zone with weak oscillation, no signs of overbought/oversold pressure.
Bollinger Bands Converging: Channel narrows to $4520–$4570 (20-day minimum range), indicating a breakout is near.
Cycle Resonance:
Quarterly EMA(60)= $4500: Coincides with weekly cloud baseline, forming a strong support level.
Fibonacci Key Levels: Retraced from May high of $4577, with 38.2% at $4545 as the intraday center, and 61.8% at $4520 as the bullish line of defense.
Key Support and Resistance Levels
Bearish Fortress (Resistance):
$4560: 20-day moving average + May downtrend line resistance, breaking above opens space to $4600.
$4577: May 25 high, concentrated gamma resistance zone in options.
Bullish Barrier (Support):
$4520: Bollinger lower band + 61.8% Fibonacci retracement, the intraday dividing line between strength and weakness.
$4500: Quarterly moving average + central bank gold purchase cost anchor zone, with less than 10% probability of breaking below this ultimate defense.
Market Outlook: Triple-Drive Logic and Risk Warnings
▶️ Short-term Catalysts (24-48 hours)
Federal Reserve Policy Play:
If Fed Governor Waller signals a delay in rate cuts at 22:00 today (current 68% probability of a September cut), gold prices may dip back to $4520.
Conversely, if emphasizing recession risks, hedge funds’ short covering will push prices up to $4560.
Geopolitical Powder Keg:
Attacks on Red Sea shipping increase oil premiums; if conflict spreads to the Strait of Hormuz, gold will surge directly past $4600.
▶️ Medium-Long Term Structural Support
Central Bank Gold Buying Hegemony:
Global central banks net purchased 244 tons of gold in Q1 (+15% YoY), with China increasing holdings for 18 consecutive months, making $4500 a new value center.
Polish central bank announced an additional 100 tons by 2026; institutional models show central bank buying triggers below $4300.
Inflation Reversal Expectations:
US 5-year inflation expectations rose to 2.48% (New York Fed data), weakening real interest rate suppression.
⚠️ Downside Risk Alerts
Dollar Black Swan: If US Q1 GDP revision exceeds expectations (initial 3.1%), the dollar index may rally to 104, suppressing gold to $4480.
Algorithmic Trading Flash Crash: There are 2.7 million ounces of algorithmic sell orders below $4520, and technical breakdowns could trigger a 2% flash crash.
Trading Strategies:
Aggressive:
Buy lightly at $4545 with small positions, stop-loss at $4515 (0.7% tolerance for breakdown), target $4560→$4577.
Conservative:
If retesting $4520 and stabilizing, add positions, betting on central bank support, with a target of $4600 (about 6% upside).
Breakout Chase:
Volume breakout above $4577 to chase the rally, aiming for $4620 (March high + Gann angle resistance).