橙子研究院

vip
Market Analyst
Crypto Market Researcher
Age 9 Year
Entered the industry in 2015|A seasoned Crypto investor with 10 years of experience|Specializes in trend analysis, focusing on medium to long-term strategies + swing profit-taking|Utilizes the【Chan Theory】system to analyze and break down cryptocurrency market trends|Thank you for your attention, let's move forward together on the investment journey!
【U.S. stocks are going wild and pushing to new highs, and the danger signals for Bitcoin are becoming increasingly clear】
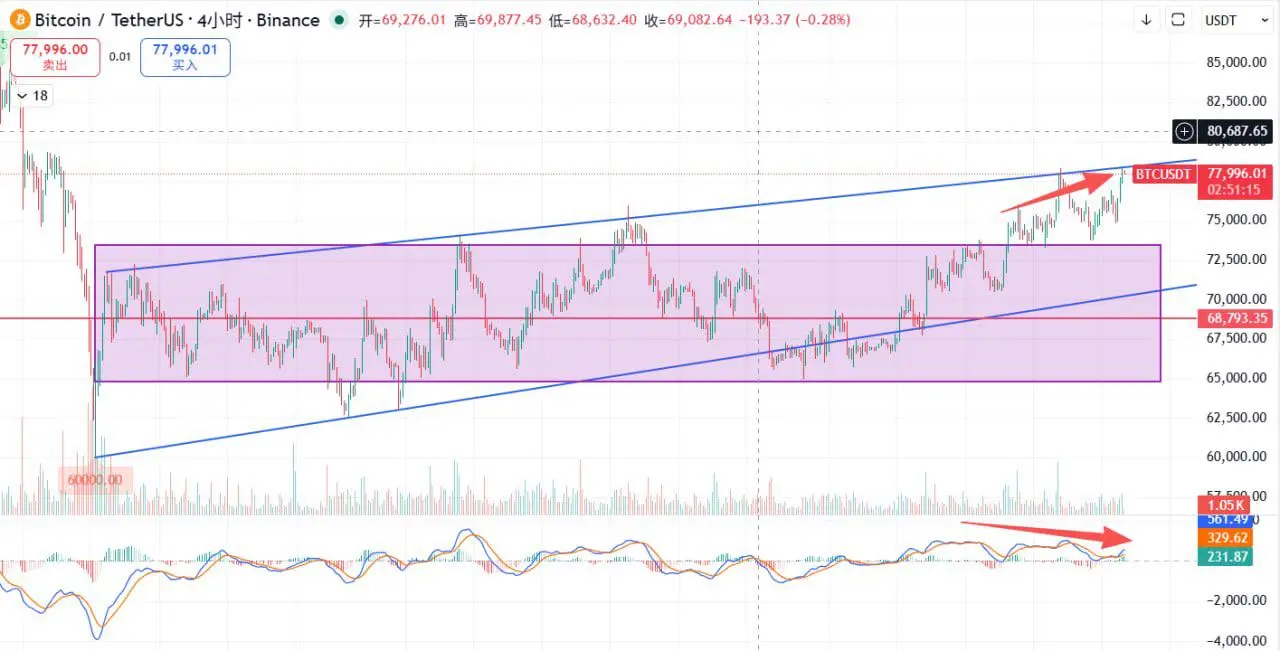
There isn’t really much that can be said about the current market. Bitcoin is basically moving within the framework we discussed earlier; nothing has come out to be particularly shocking. You can flip back to the previous article—Bitcoin was trading within the angle formed by the trend lines. A direct plunge down was unrealistic, and it would have to go down again after first reaching the area near the previous high. Those were essentially “forecasts based on the obvious,”
BTC1.02%
ETH1.05%
View Original
post-image
  • Reward
  • Comment
  • Repost
  • Share
[The copycat projects are starting to become active, but the Bitcoin danger signals have appeared. How should we operate?]
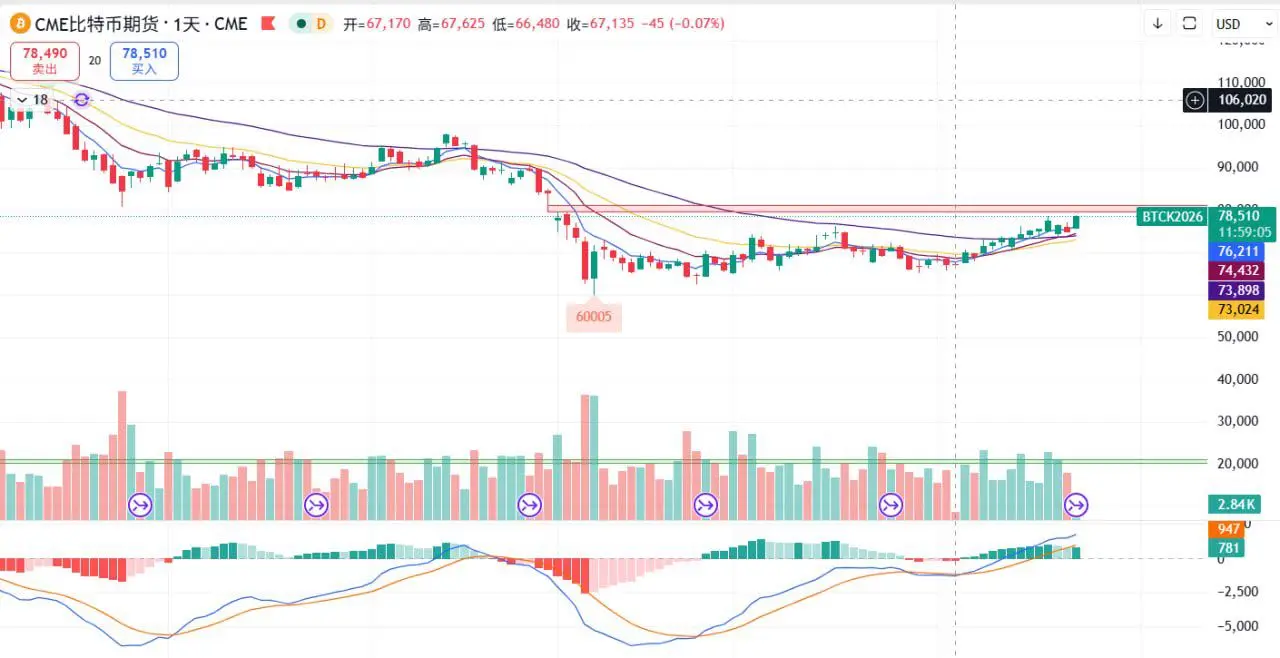
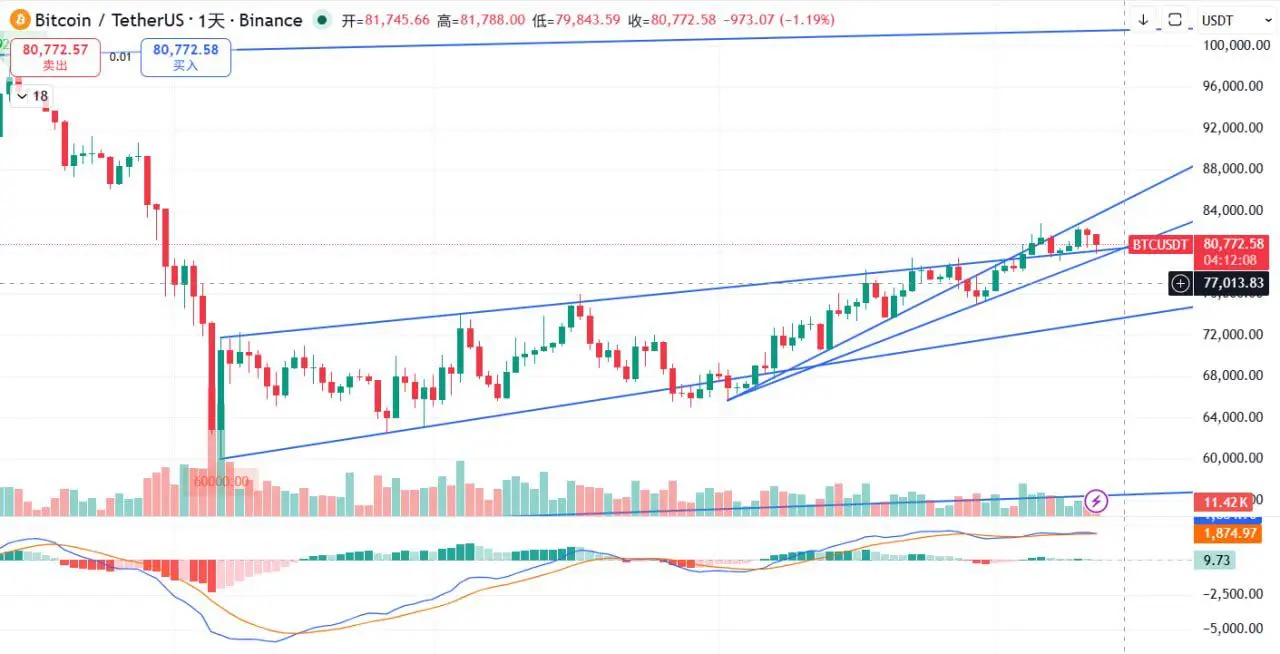
In May, Bitcoin continued to surge toward the CME gap resistance zone. Stimulated by news, the bullish momentum clearly strengthened, and it finally started to pull back after filling the gap and reaching a high of 82,850.
Although the high point is slightly higher than our previous estimate, with some numerical drift, the overall impact is not significant.
Why do I say that?
Because the daily closing price ultimately was 81,447, again returning near the resistance zone, a
APT1.32%
SOL0.94%
View Original
post-image
post-image
post-image
  • Reward
  • Comment
  • Repost
  • Share
Yesterday, it was already made very clear, 81000 is the risk zone
Today, it reached a high of 81323, now hovering around 80600, at this position pushing higher is likely to be a trap
The idea remains the same: in the medium term, look for a pullback.
First watch 76000, if broken, then look at around 74000
A pullback to around 74000-76000 can be a good entry point. Currently, the bullish candlestick in April has completely engulfed the March upper shadow, and a bullish engulfing pattern is a strong bullish signal. Plus, the MACD histogram is shrinking, and the monthly cycle is large enough, so
BTC1.02%
ETH1.05%
View Original
post-image
post-image
橙子研究院
【 Monthly strong rebound, is a new wave of BTC rally coming? 】
Starting in May, what new changes have appeared in Bitcoin's trend for this new month? Let's analyze together.
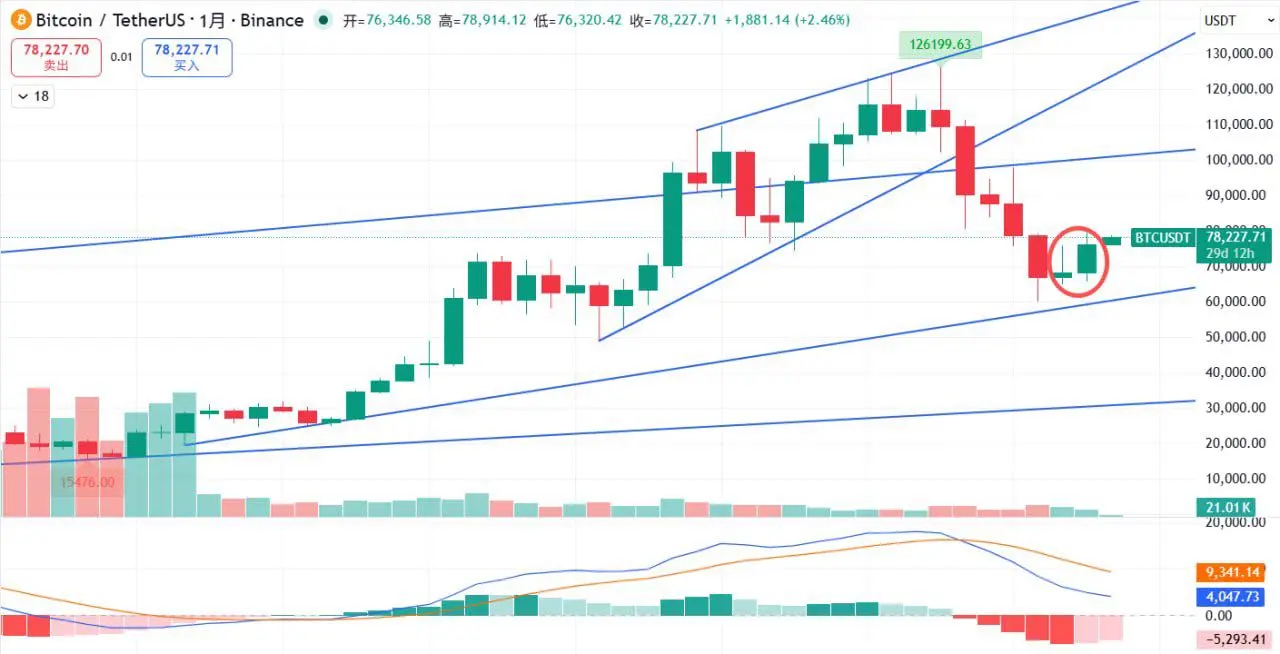
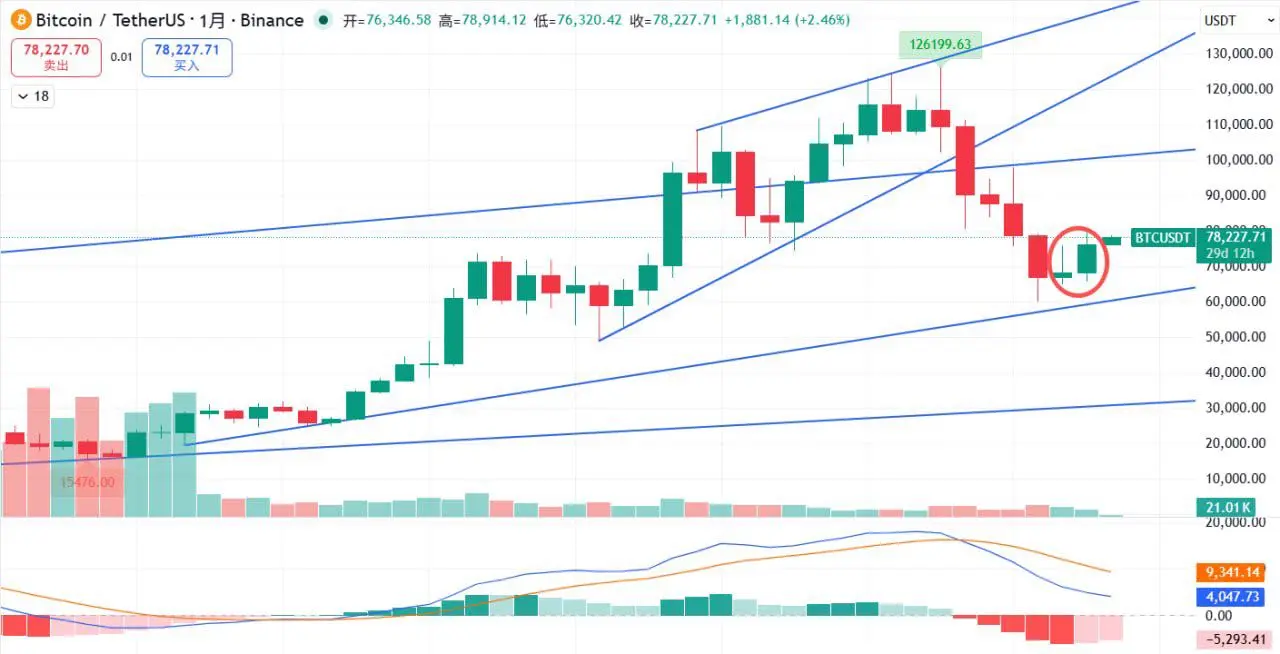
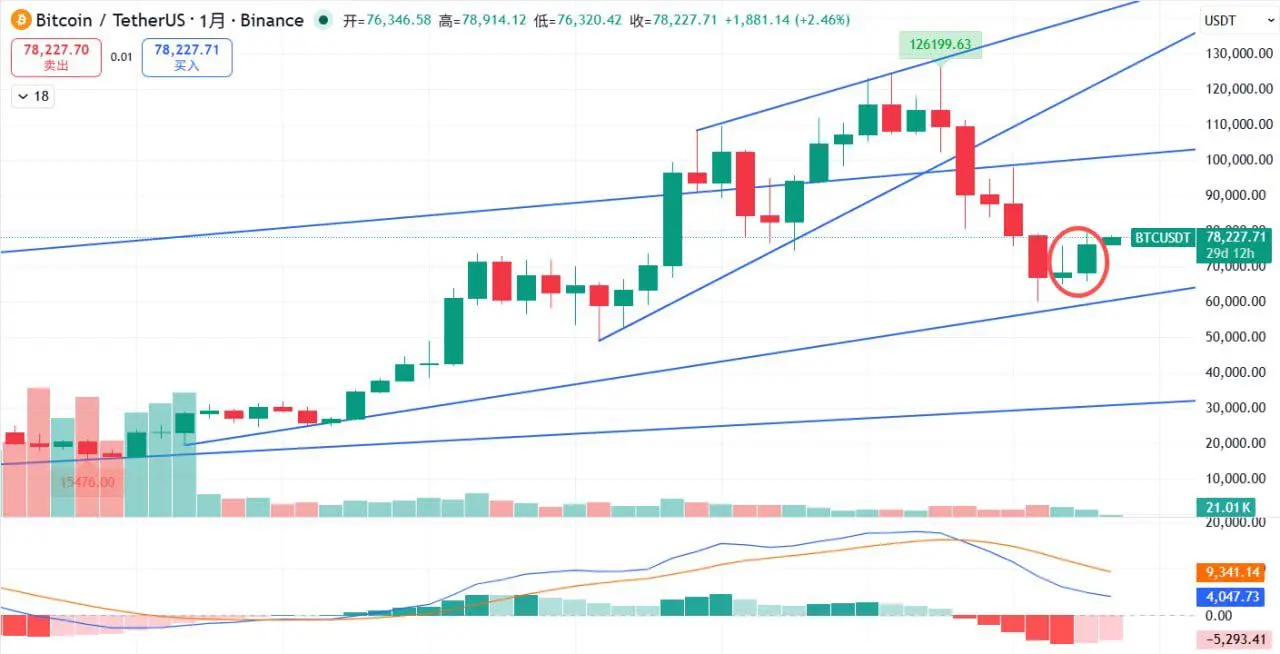
First, the monthly chart has closed, and from the monthly perspective, Bitcoin is looking quite bullish. The April candlestick has completely engulfed the March upper shadow, forming a bullish engulfing pattern, which is a strong bullish signal. Plus, the MACD histogram is shrinking, and since the monthly cycle is quite large, we can judge that May will be a good month, at least not experiencing the previous sharp decline. It will likely see a narrowing of the decline and a start of an upward move.
But here, a reminder: this is only the end of a downward trend, not a complete trend reversal. Looking at the MACD, it is still some distance from the zero line. Additionally, considering the previous bear market timing and decline patterns as "carving a boat to seek a sword," a comprehensive judgment suggests that after the rebound, there will still be a final dip structure before a reasonable upward trend.
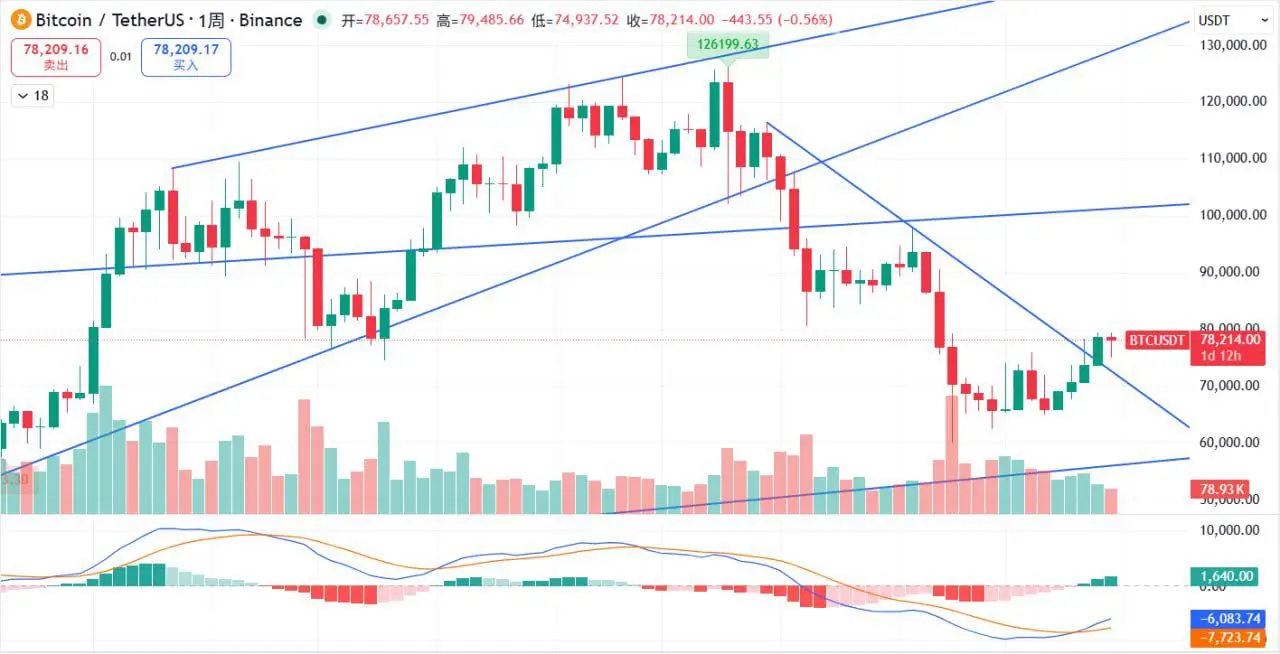
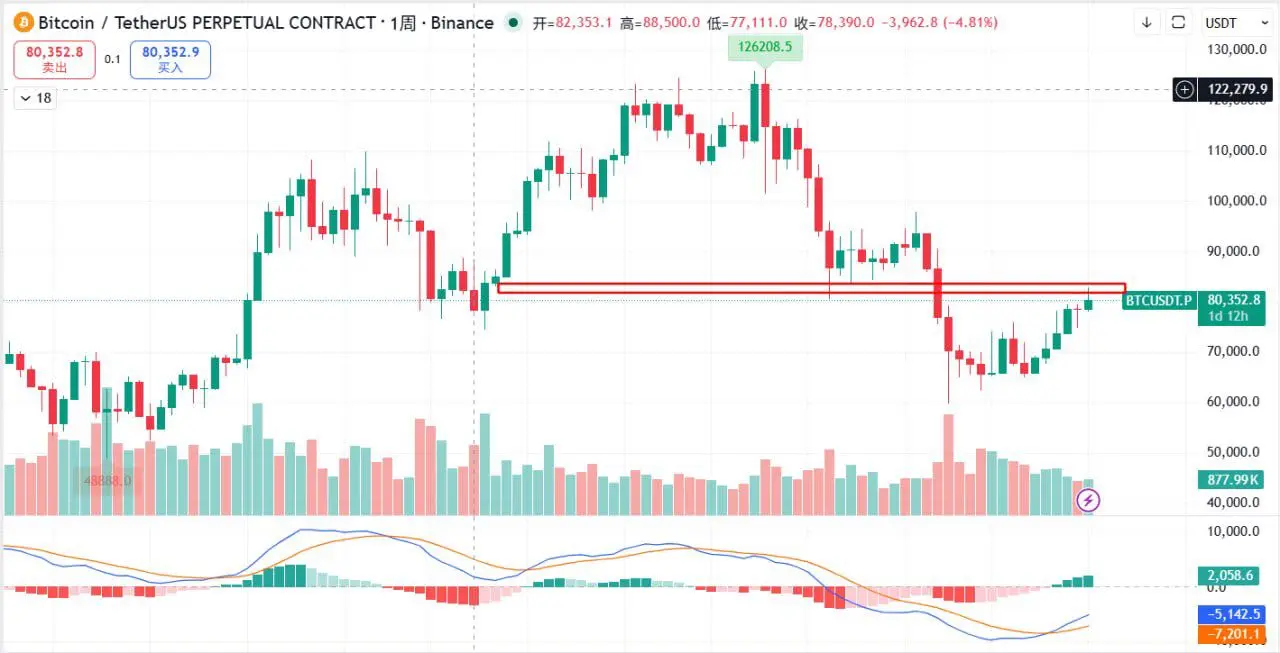
From the weekly chart, a double bottom pattern has formed, the neckline has been broken and stabilized, and the downward trendline has been broken and stabilized, indicating potential for further upward movement.
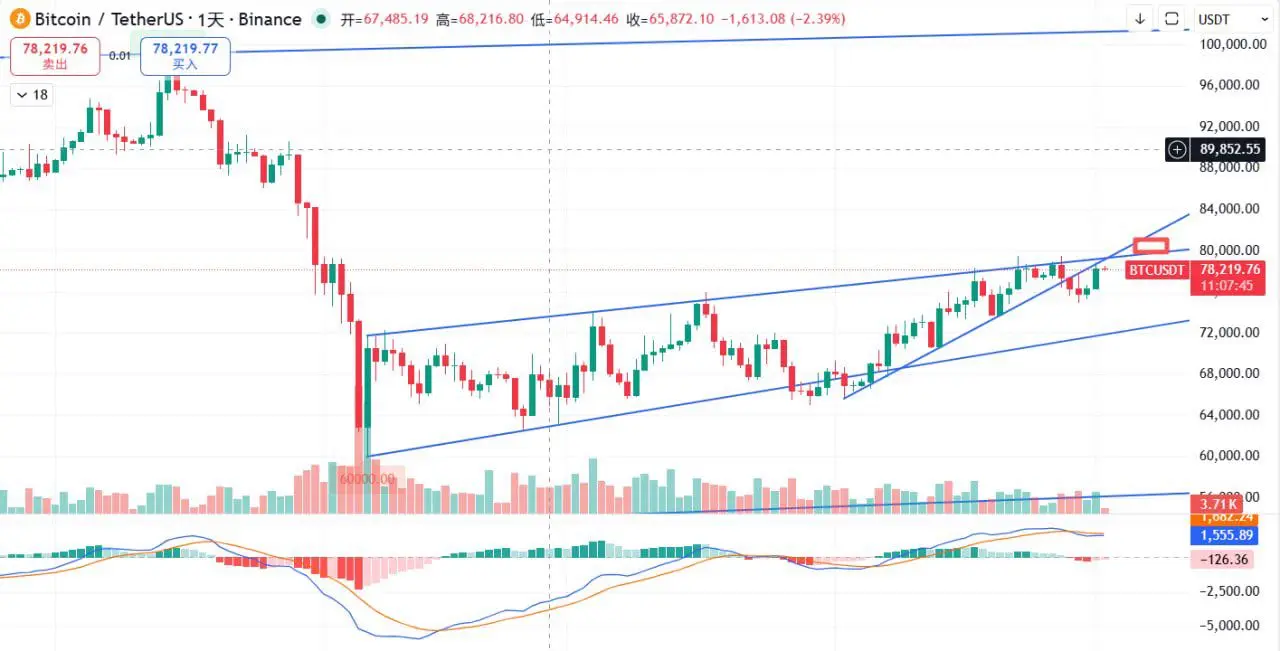
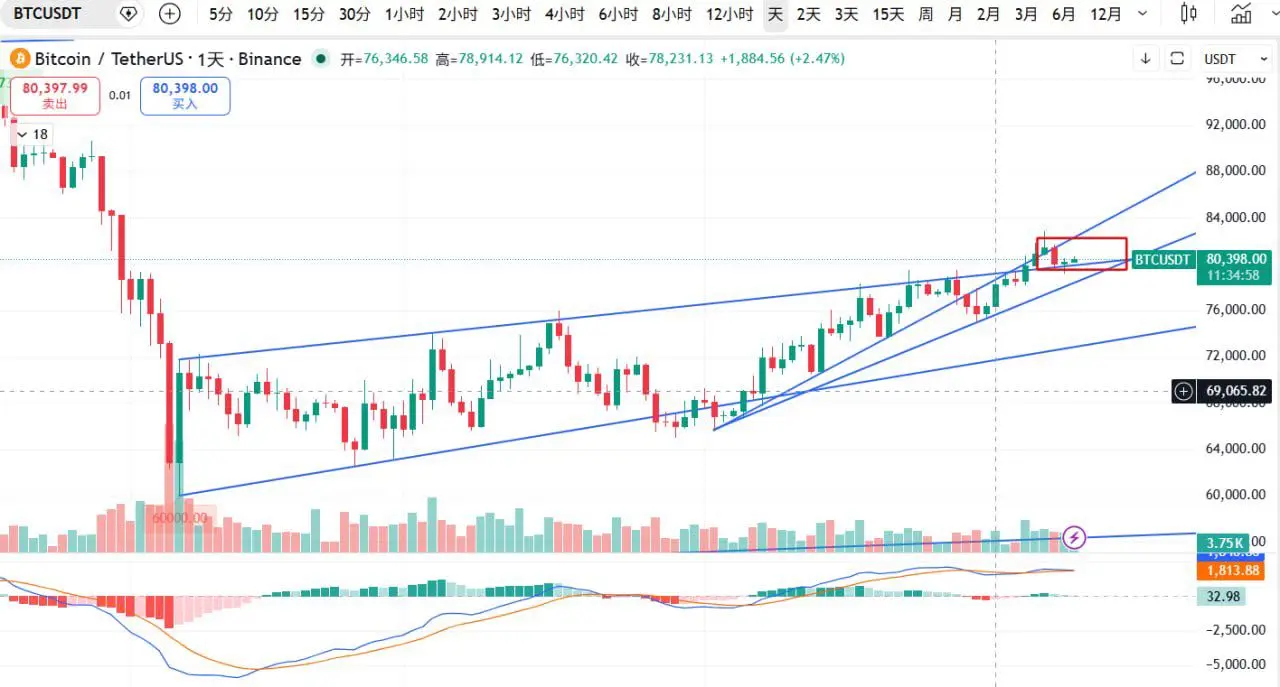
On the daily chart, Bitcoin has once again reached the upper edge of the flag pattern, which may face some resistance here, requiring some consolidation. Due to the improvement of the larger cycle pattern, the outlook remains optimistic for a breakout, heading towards the CME gap pressure we have mentioned multiple times!
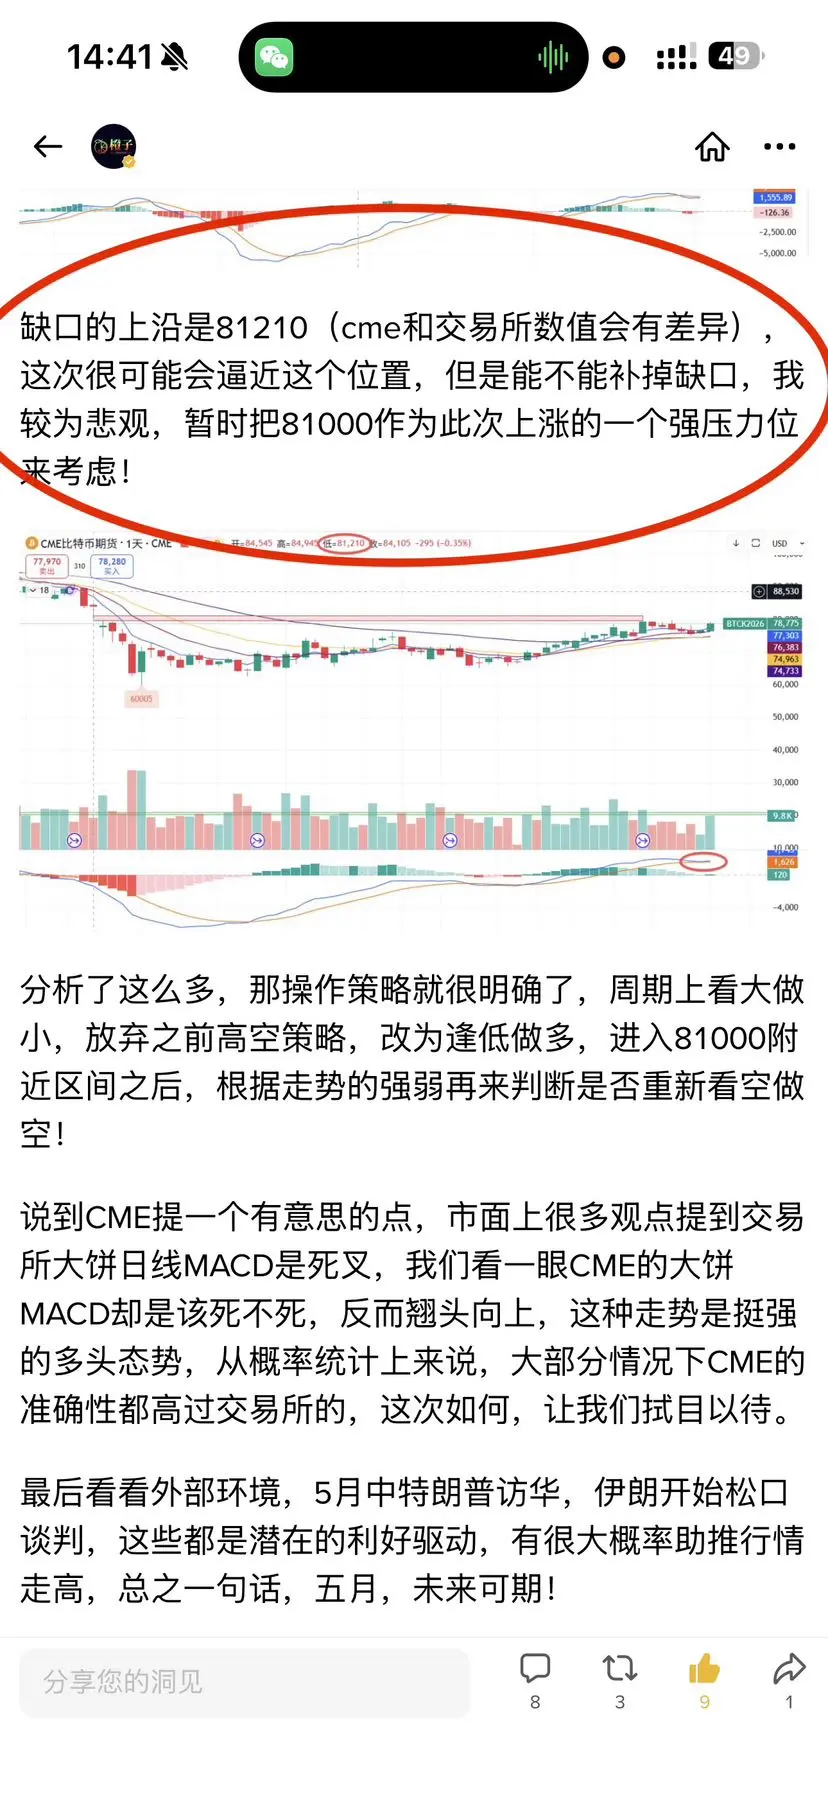
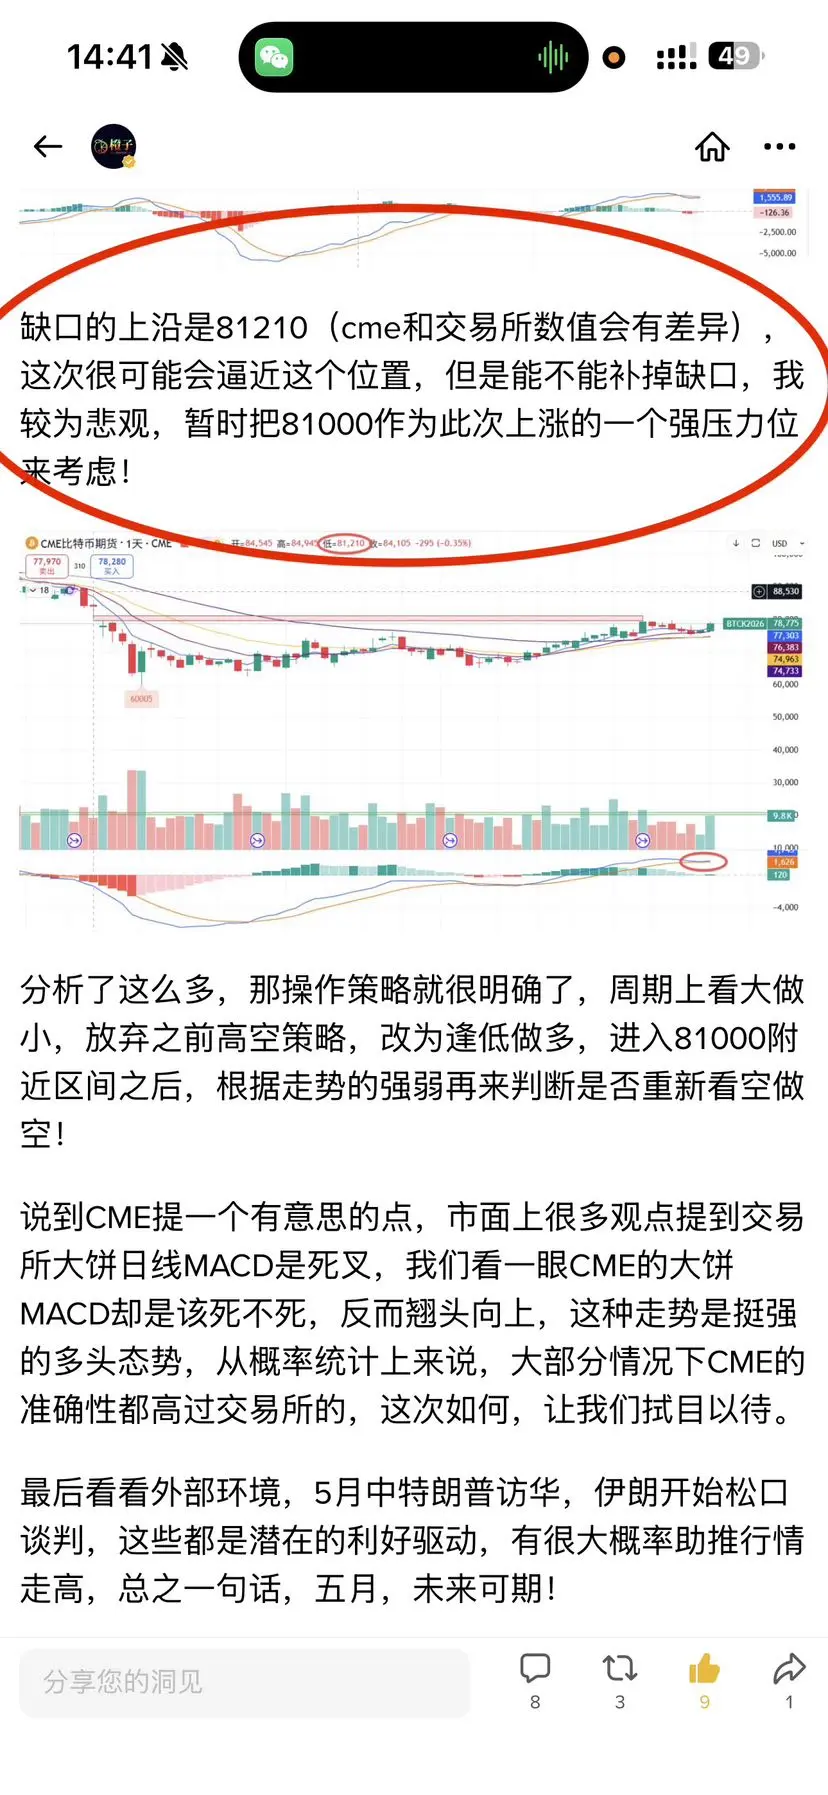
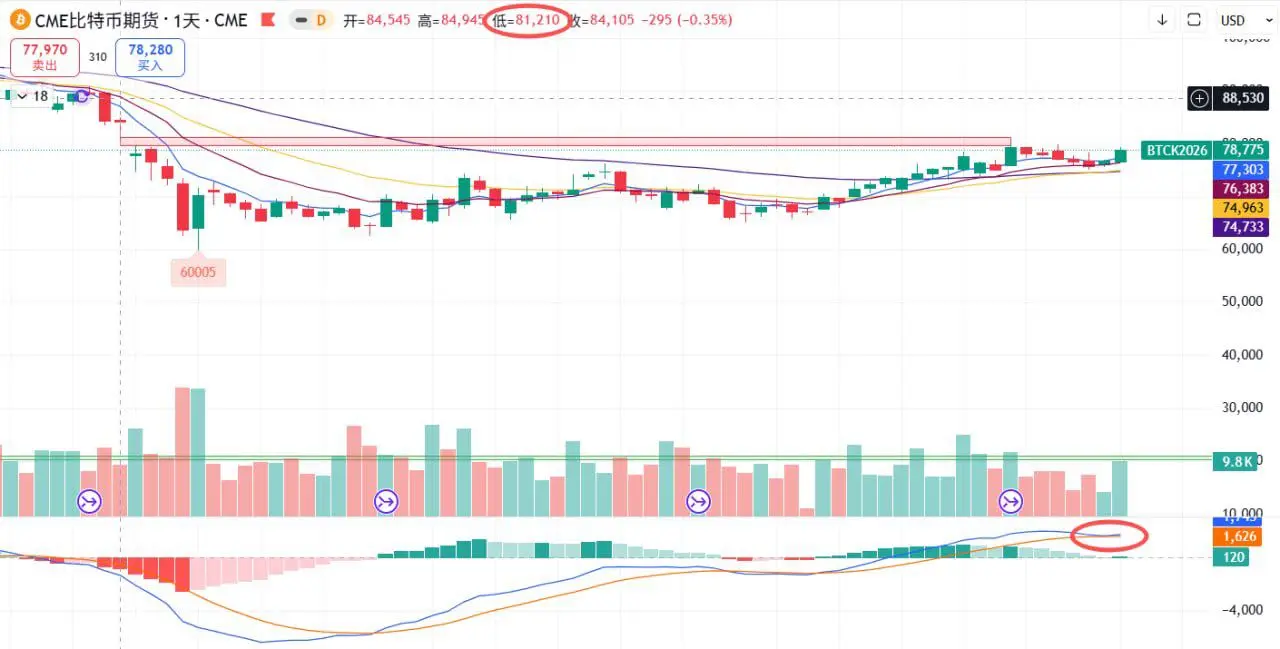
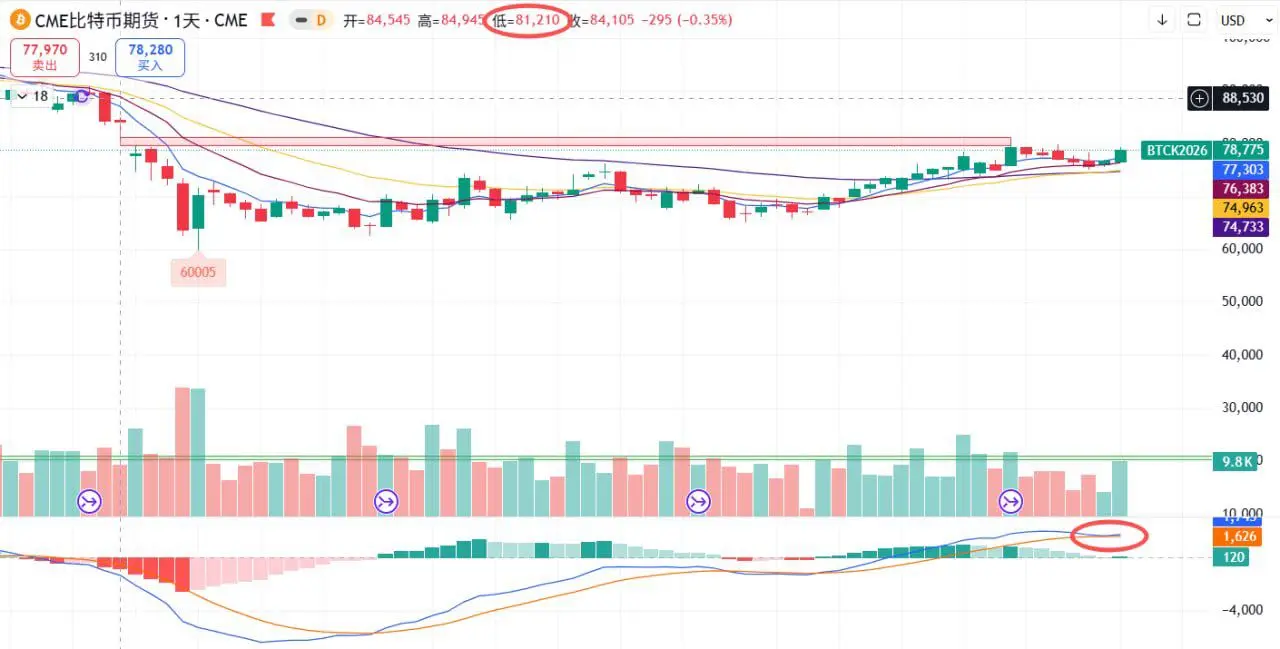
The upper edge of the gap is at 81,210 (CME and exchange values may differ). This time, it is very likely to approach this level, but whether the gap will be filled is uncertain. I am somewhat pessimistic about that, temporarily considering 81,000 as a strong resistance level for this rally.
Having analyzed so much, the trading strategy is quite clear: on a cycle basis, go for smaller timeframes; abandon the previous high-altitude short strategy and switch to buying on dips. After entering the 81,000 zone, judge whether to re-enter short positions based on the strength of the trend.
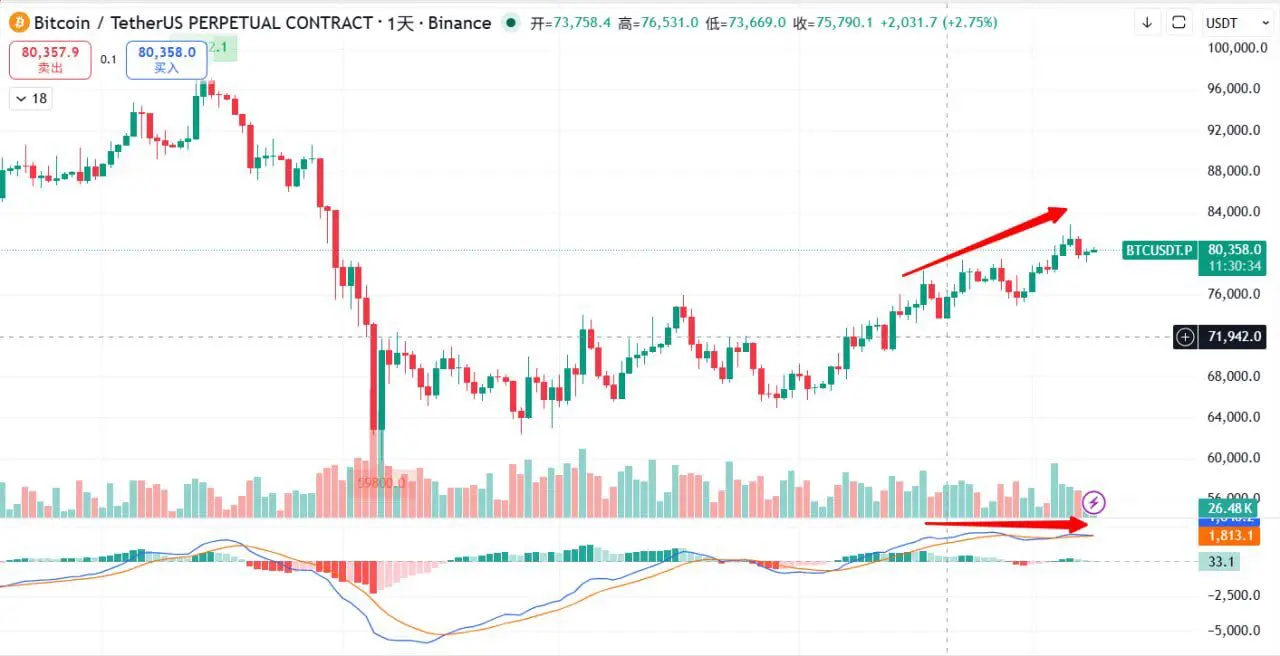
Regarding CME, here's an interesting point: many market opinions mention that the daily MACD of the exchange's Bitcoin is a death cross. However, looking at CME's Bitcoin MACD, it is not dead but instead turning upward. This indicates a strong bullish trend. Statistically, CME's signals are often more accurate than the exchange's. Let's wait and see how this develops.
Finally, looking at the external environment: in May, Trump visits China, and Iran begins to loosen negotiations. These are potential positive drivers that could boost the market. In summary, May looks promising for the future!
repost-content-media
  • Reward
  • Comment
  • Repost
  • Share
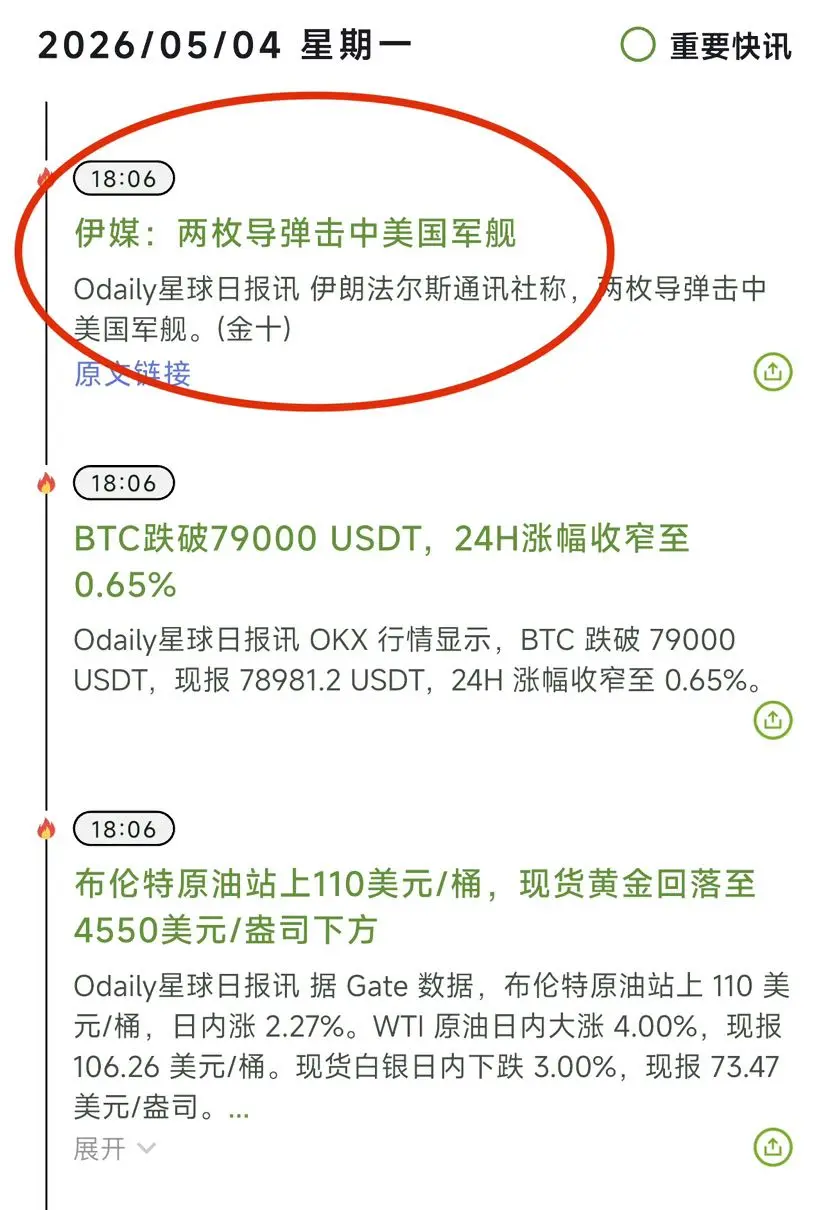
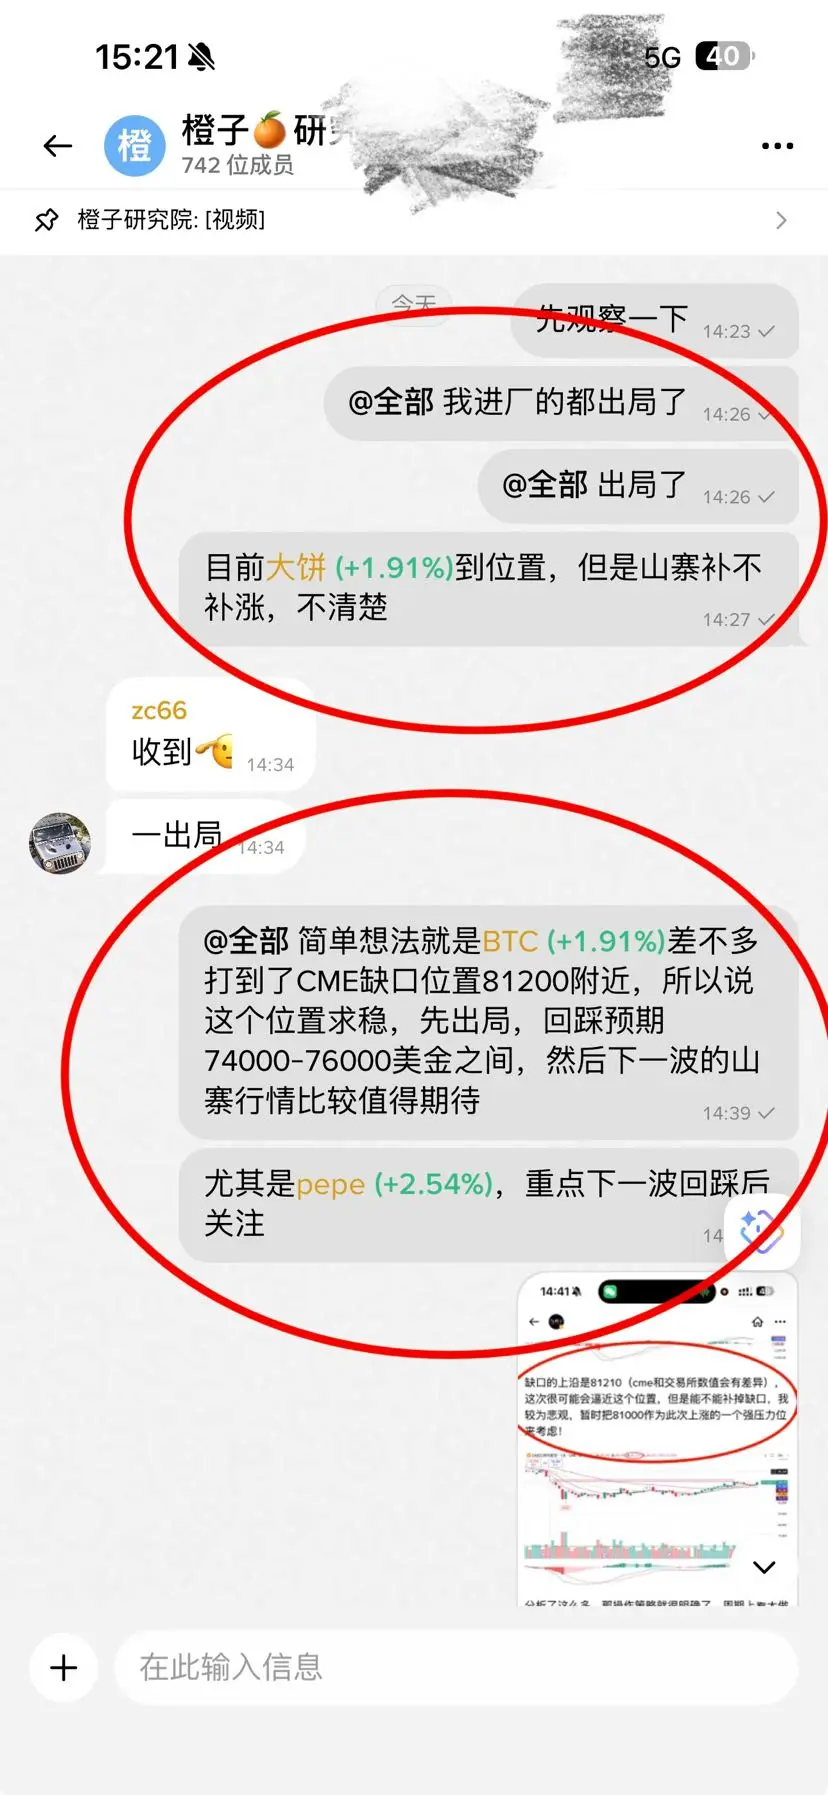
【中午刚喊全部出局,下午黑天鹅就来了】
今天这波节奏,确实有点像开了天眼。
中午刚在群里提醒现货先出局,下午市场就来了战争消息。
很多朋友都说:你这是不是提前知道内幕?
真不是内幕。 只是盘面位置已经提前给出了答案。
前面我明确说过的
BTC上方强压:81000美金附近
首次触碰强压,大概率会有回调风险
尤其冲高回落,容易形成高位背离
结果今天怎么走
币安最高触及 80635
CME最高冲到 81015
基本就是精准打到我们前面说的压力区
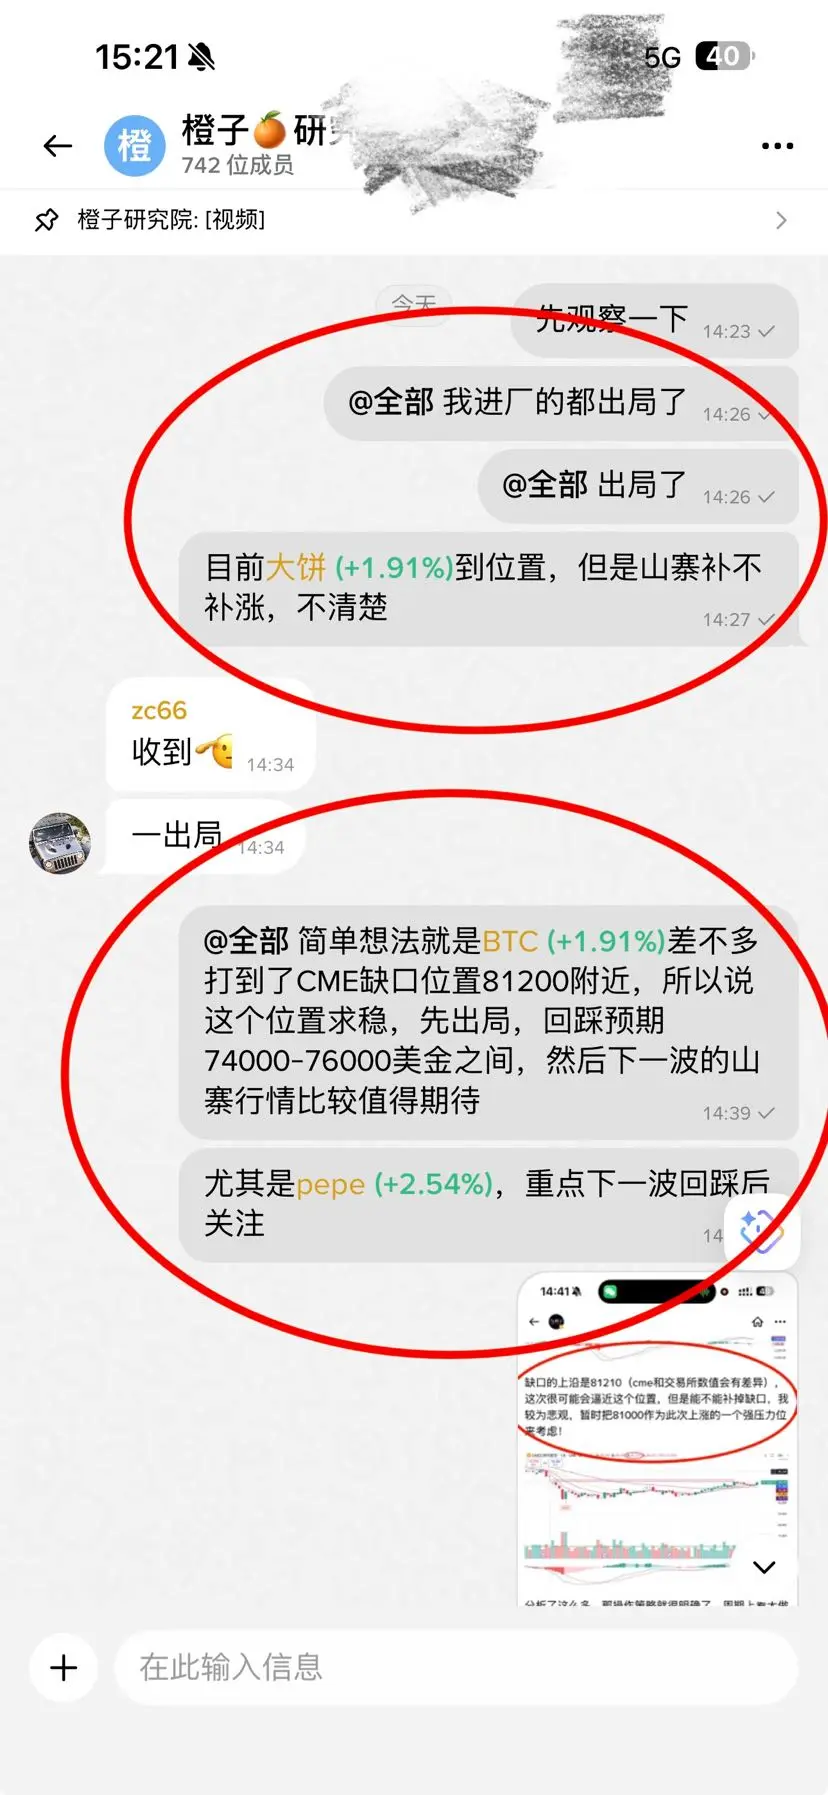
群里同步时间点(截图时间都在)
14:26:我进厂的都出局了,全部出局
14:39:BTC差不多打到CME缺口 81200 附近;这个位置先求稳
回踩预期:74000-76000美金
接下来我依旧这样执行
BTC短期支撑:76100
下方强支撑:74200
如果后面回踩到 74000-76000 区间,
再结合下跌力度和成交量,重新判断入场机会。
下一波重点看山寨补涨
尤其是:PEPE、SOL、DOGE
很多山寨日线已经压得很平,
一旦BTC稳住,五月份山寨反而可能有更好的表现机会。
今天这波先落袋,后面等市场把机会送到面前。
不追高,不上头,按计划交易,才是长期活下来的关键。
#油价突破110美元 $BTC
BTC1.02%
post-image
post-image
post-image
  • Reward
  • Comment
  • Repost
  • Share
【走势精准兑现,81000 美金风险预警】
大饼走势完全符合预期,目前已然触及前期所说强压81000附近。
币安盘面最高触及80635,CME市场冲高至81015。
行情首次触碰强压力位,大概率迎来大幅回调,尤其冲高回落走势,极易形成高位背离。
现阶段切记切勿盲目追高。
短期关键支撑看76100一线,下方强支撑落在74200附近。
后续跌至支撑位置,结合下跌幅度与成交量,再判断入场机会。
当前优先落袋止盈,保持观望姿态即可。
即便后续价格成功突破压力位,回踩阶段依旧可以布局山寨币补涨行情,无需过度焦虑。
操作想法:大饼回落到 74000-76000 美金之间,下一波山寨重点关注,尤其是 pepe 和 sol,doge 这些次主流,日线基本都快走成一个直线,这个月大饼不会有太大跌幅,所以 5 月份是山寨表现机会的月份,好好把握
#BTC走势分析 $BTC #山寨季何时到来? $PEPE
PEPE1.83%
BTC1.02%
post-image
post-image
  • Reward
  • Comment
  • Repost
  • Share
【 Monthly strong rebound, is a new wave of BTC rally coming? 】
Starting in May, what new changes have appeared in Bitcoin's trend for this new month? Let's analyze together.
First, the monthly chart has closed, and from the monthly perspective, Bitcoin is looking quite bullish. The April candlestick has completely engulfed the March upper shadow, forming a bullish engulfing pattern, which is a strong bullish signal. Plus, the MACD histogram is shrinking, and since the monthly cycle is quite large, we can judge that May will be a good month, at least not experiencing the previous sharp decline.
PEPE1.83%
LDO0.76%
View Original
post-image
post-image
post-image
post-image
  • Reward
  • Comment
  • 1
  • Share
Brothers and sisters, I'm getting in the car ┏(^0^)┛🚗 Wish me luck
Additionally, SOL84 USD price is also very cost-effective; whether to buy or not depends on yourself
I'll share detailed opinions tonight, for everyone to reference
#BTC $ETH #LayerZero承诺以超1万枚ETH支持DeFiUnited $SOL
SOL0.94%
ETH1.05%
View Original
  • Reward
  • Comment
  • Repost
  • Share
【Big global events are piling up—this week you only have three words left: Guess Big or Small】
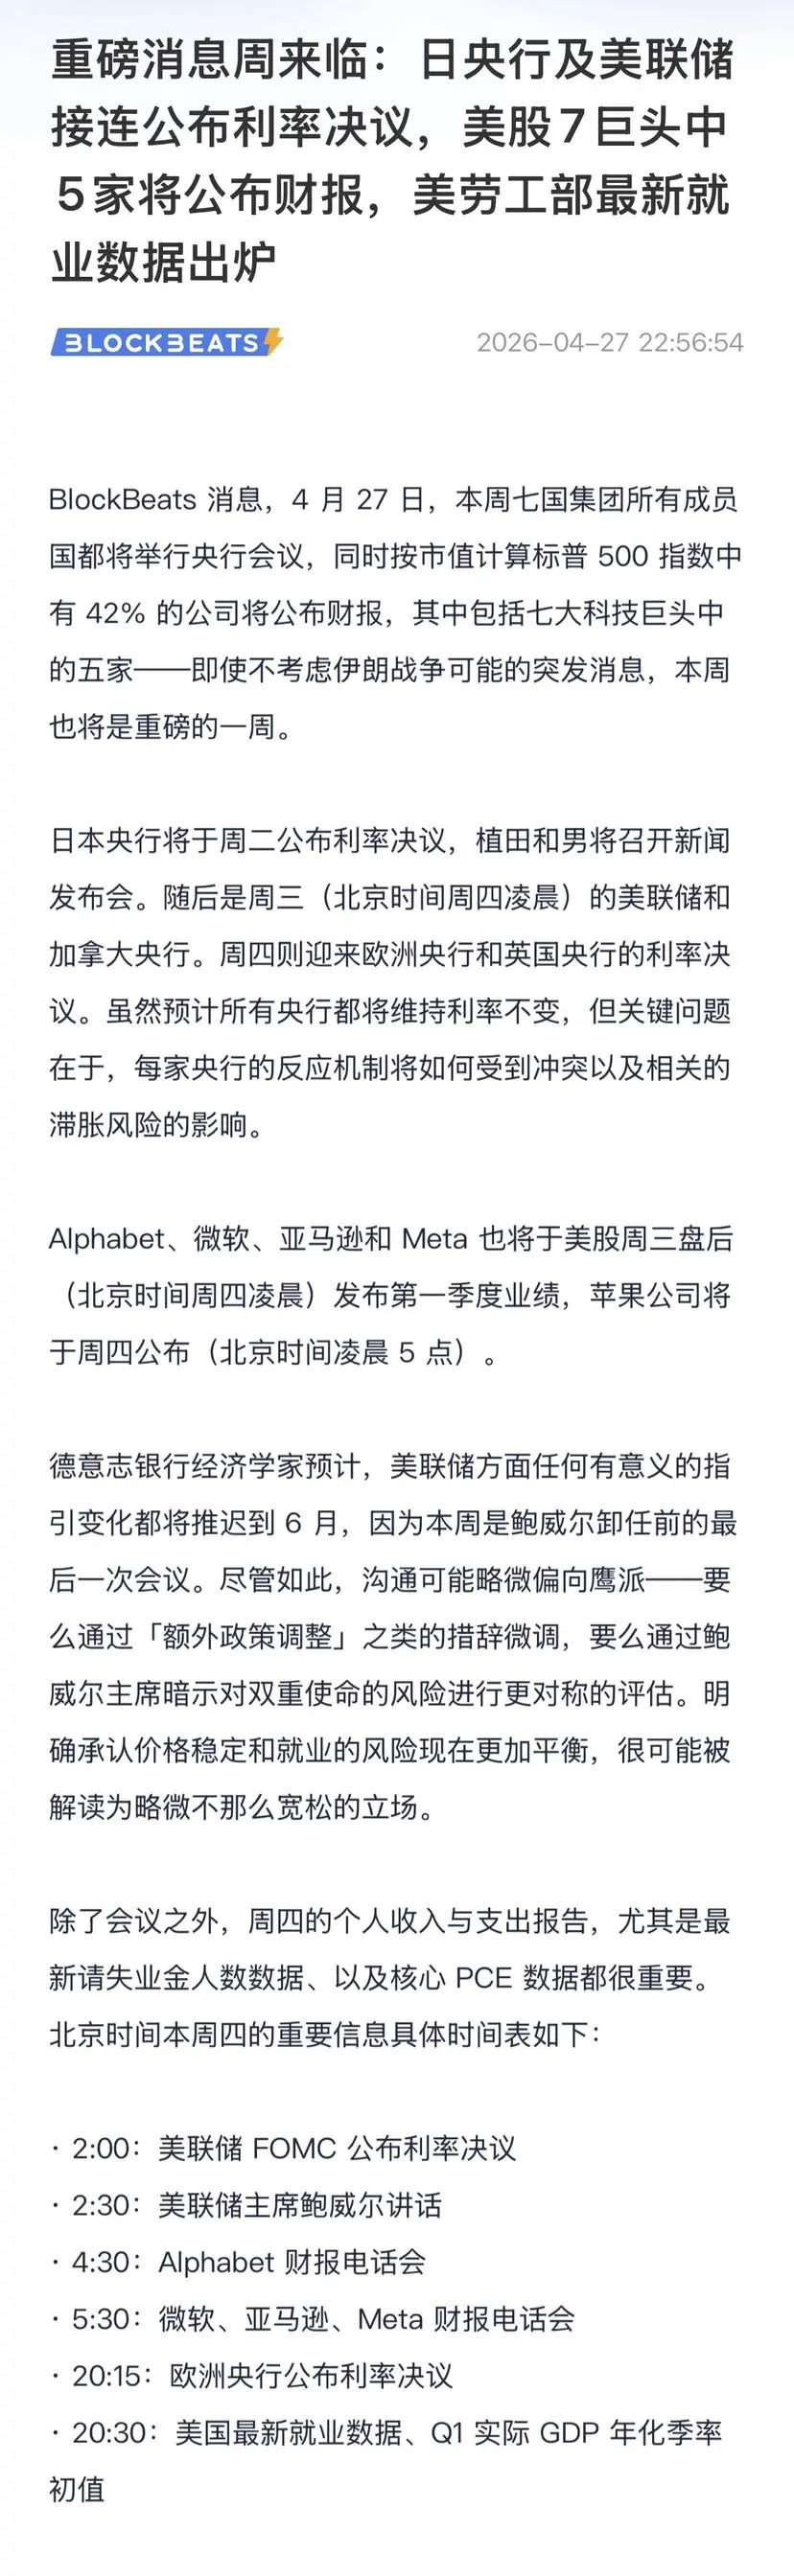
This week’s key event timeline (Beijing time)
• Tuesday: Bank of Japan interest rate decision + press conference
• Wednesday 02:00: Federal Reserve FOMC interest rate decision
• Wednesday 02:30: Federal Reserve Chair speech
• Wednesday/Thursday early morning: Alphabet earnings call
• Thursday 05:30: Microsoft, Amazon, Meta earnings
• Thursday 20:15: European Central Bank interest rate decision
• Thursday 20:30: Latest U.S. employment data + GDP preliminary estimate
This week is really somethin
ETH1.05%
BTC1.02%
View Original
post-image
  • Reward
  • Comment
  • Repost
  • Share
Agrees with yesterday's view, the medium-term outlook remains cautiously bearish.
The current structure has not experienced any substantial reversal; the rebound is more of a continuation within consolidation rather than a trend reversal.
The target levels remain unchanged:
The first target is 74,000,
The second target is still around 64,000.
If the downward trend continues, the ultimate target still points below 60k USD.
The overall approach remains the same: patiently wait for a pullback, and friends with heavy positions should set a strict stop-loss to prevent potential losses. Currently, m
ETH1.05%
BTC1.02%
View Original
post-image
橙子研究院
【Bullish divergence is confirmed, is this a breakout or a decline?】
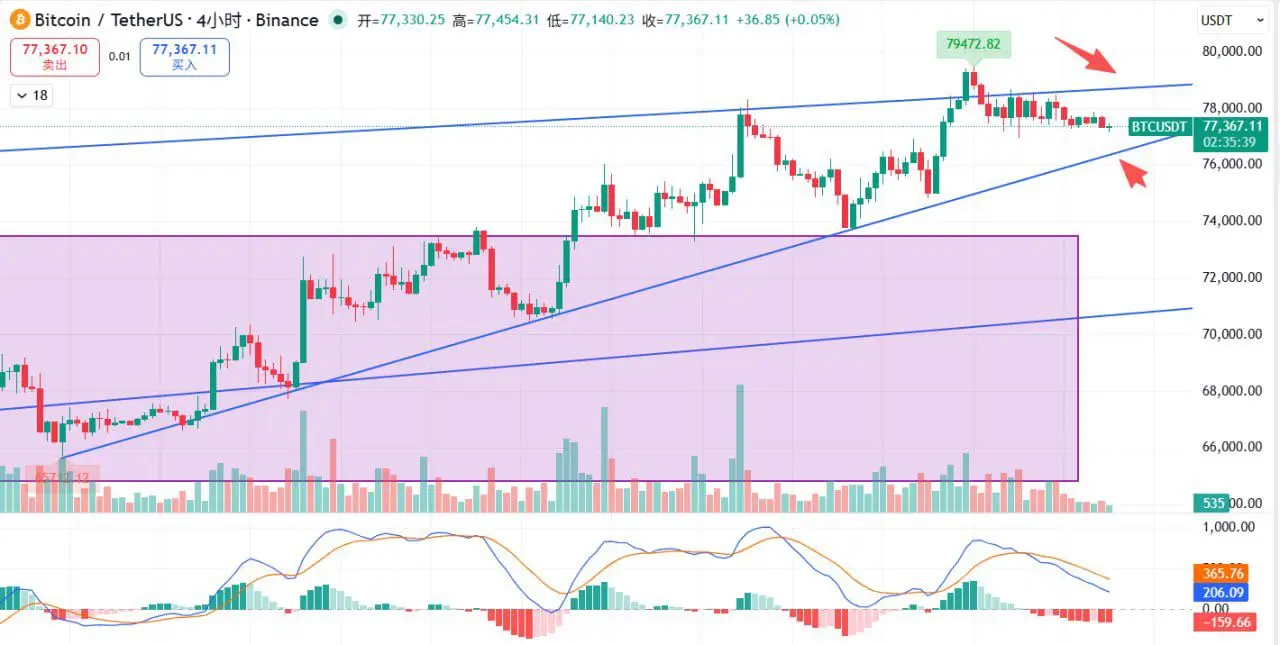
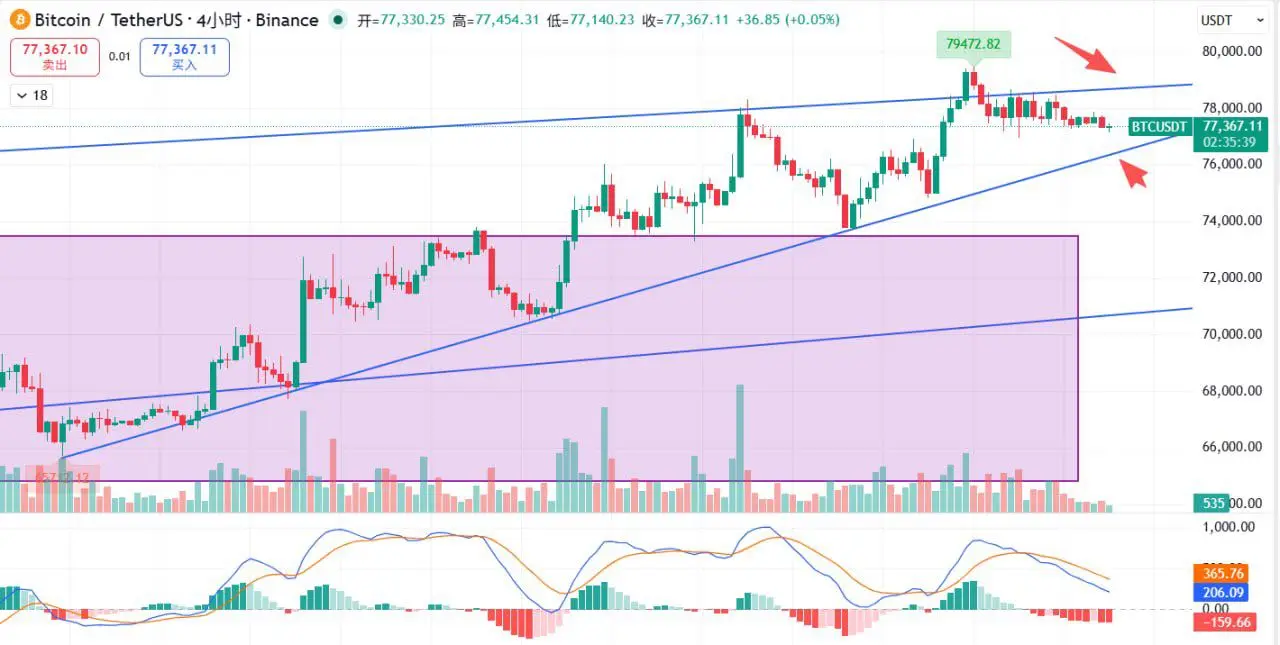
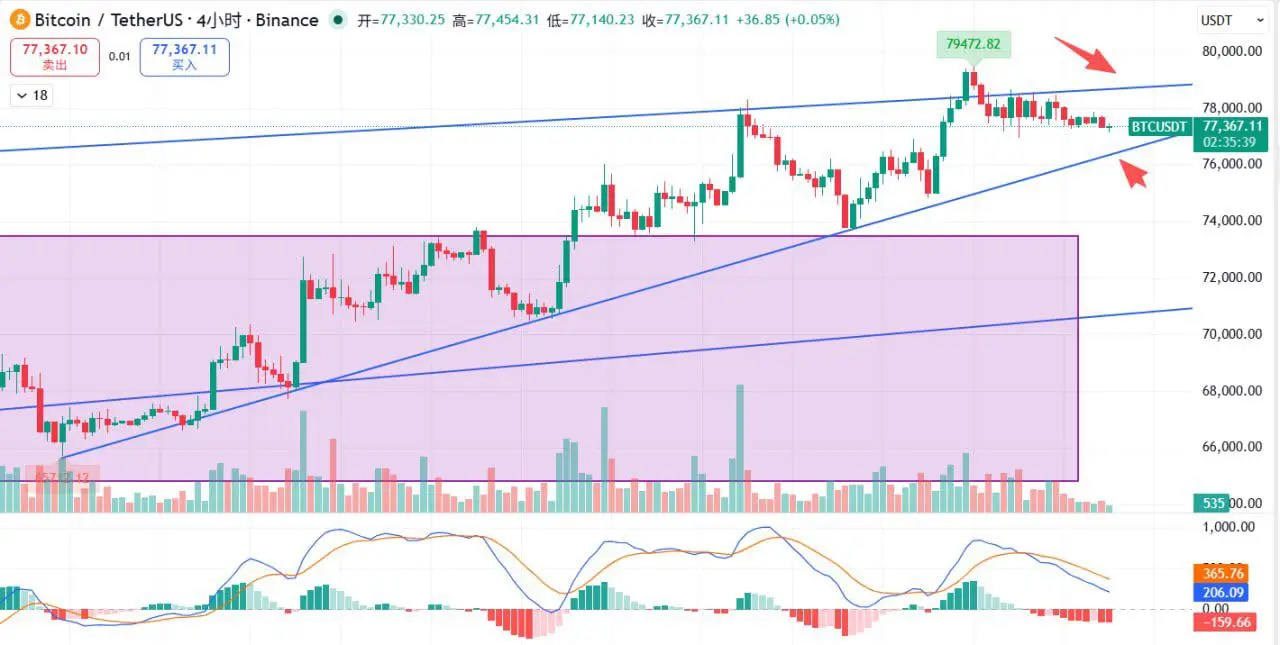
The current market is very delicate. After Bitcoin hit a high of 79,472, it did not drop immediately but chose to enter a consolidation phase.
From the 4-hour chart, the candlesticks are almost flat. Even with the news of Trump canceling his Iran trip causing a slight dip, Bitcoin only dipped slightly, showing relative strength in the market.
Because Bitcoin has refused to decline for three consecutive days under heavy resistance above, we should consider the possibility of new highs in the market, meaning it might challenge the super resistance zone around 81,000.
But at this very moment, the market is very conflicted, and we can say it is at a balance point. Although there is an expectation of new highs, the indicators on the 4-hour, 8-hour, and 12-hour charts all confirm a top divergence, so a decline here is also entirely reasonable.
The bulls and bears are fighting, and the direction is unclear...
So how should we operate?
If we are going long here, keep an eye on a defensive level at 76,200. If it effectively breaks below this, we should exit and observe.
For short positions, target 81,000. If there is an effective breakout to fill the gap, there is still room to go higher.
Those without positions don’t need to worry. For Bitcoin to truly break through this level, it must have a high volume and a rapid surge, which will inevitably have a blood-sucking effect.
If Bitcoin really goes higher, we will have plenty of time to catch up on the mainstream coins’ rally, so no need to worry about missing out!
Currently, it’s recommended to observe more and make decisions after the market shows a clear direction!
#BTC现货ETF累计突破50万枚 $BTC #Gate13周年现场直击 $ETH
repost-content-media
  • Reward
  • Comment
  • Repost
  • Share
【Bullish divergence is confirmed, is this a breakout or a decline?】
The current market is very delicate. After Bitcoin hit a high of 79,472, it did not drop immediately but chose to enter a consolidation phase.
From the 4-hour chart, the candlesticks are almost flat. Even with the news of Trump canceling his Iran trip causing a slight dip, Bitcoin only dipped slightly, showing relative strength in the market.
Because Bitcoin has refused to decline for three consecutive days under heavy resistance above, we should consider the possibility of new highs in the market, meaning it might challenge t
BTC1.02%
ETH1.05%
View Original
post-image
eth
ethETH. com
MC:$2.4KHolders:1
0.00%
  • Reward
  • Comment
  • 1
  • Share
[Yesterday said to be bearish, today the market gives the answer]
When I posted yesterday, Bitcoin was around 79,000, and I clearly pointed out: this is a high-risk zone, generally bearish outlook.
Looking back now, this position is basically the recent high point. Lack of upward momentum, continuous pressure, the market has already given the answer.
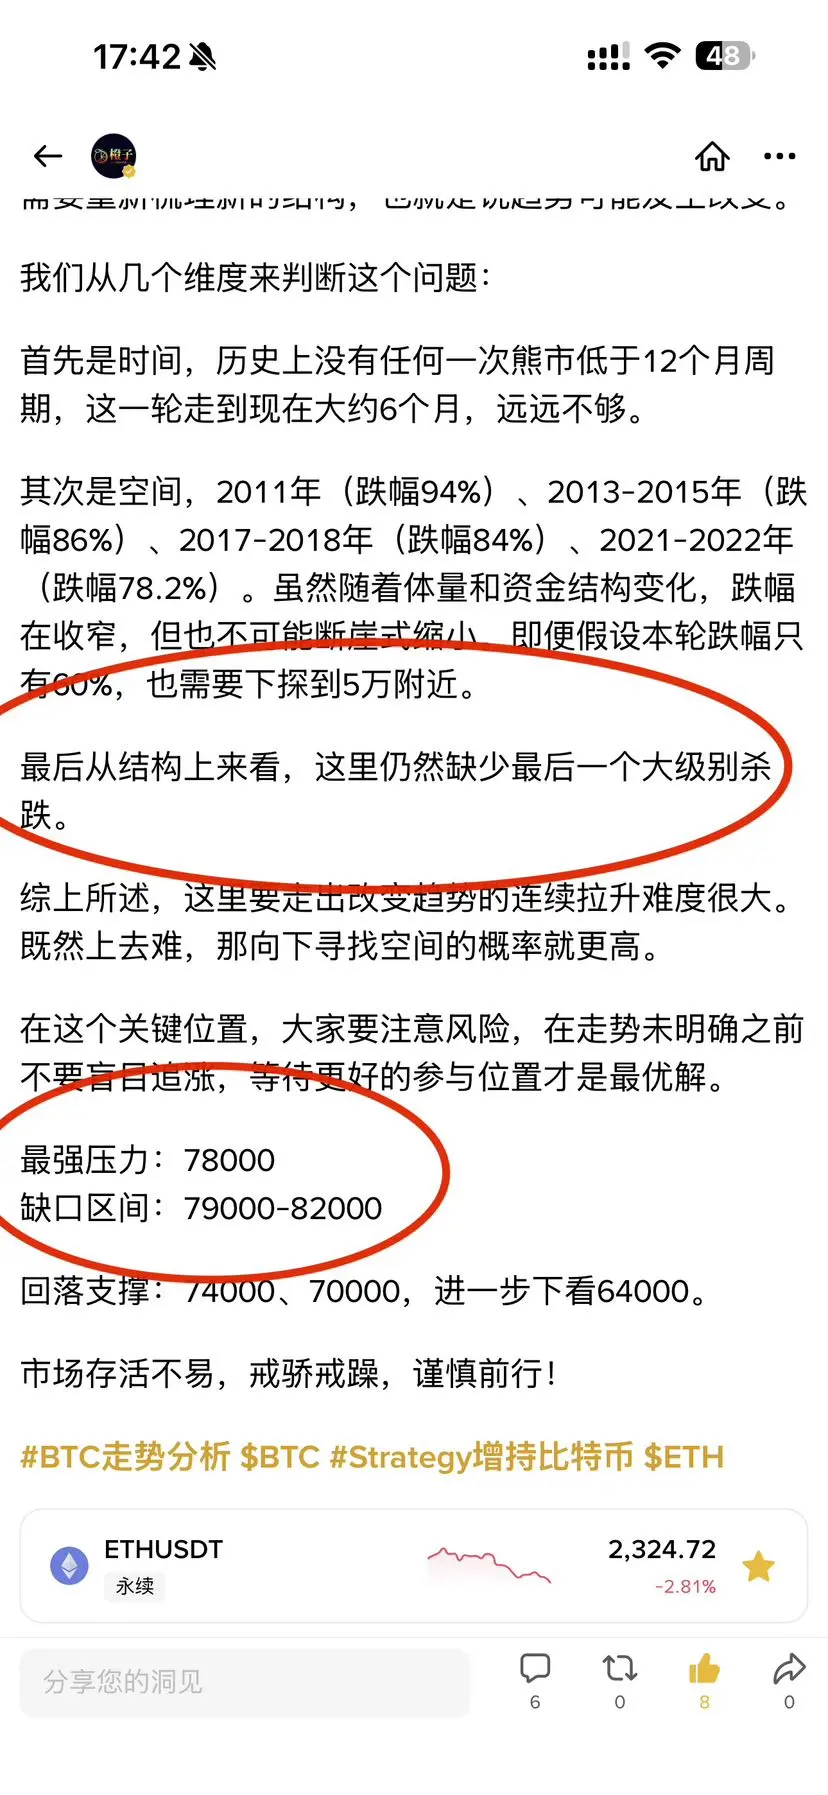
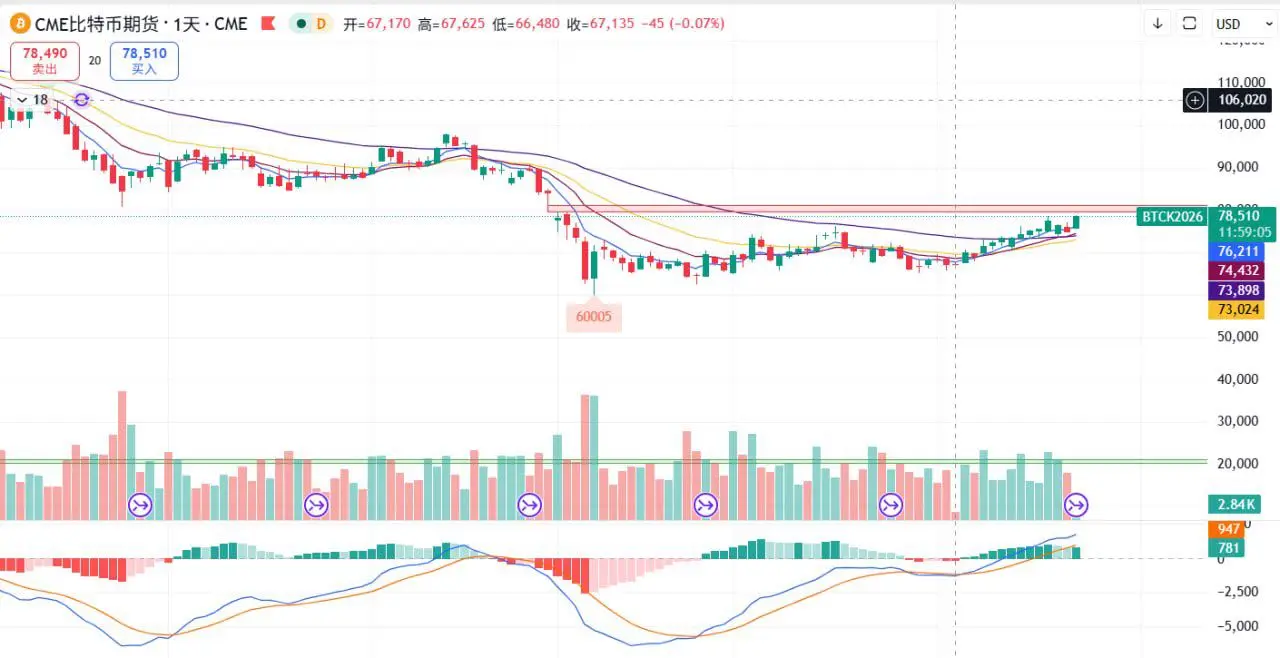
Combined with yesterday’s analysis, above 78,000 is a strong resistance zone plus a CME gap overlap zone, funds are clearly hesitant here, bullish momentum is insufficient, a rise is just a trap for late buyers.
Currently, this round of decline is
ETH1.05%
BTC1.02%
View Original
post-image
post-image
post-image
  • Reward
  • Comment
  • Repost
  • Share
【78,000 encounters resistance again — can it really not go higher this time?】
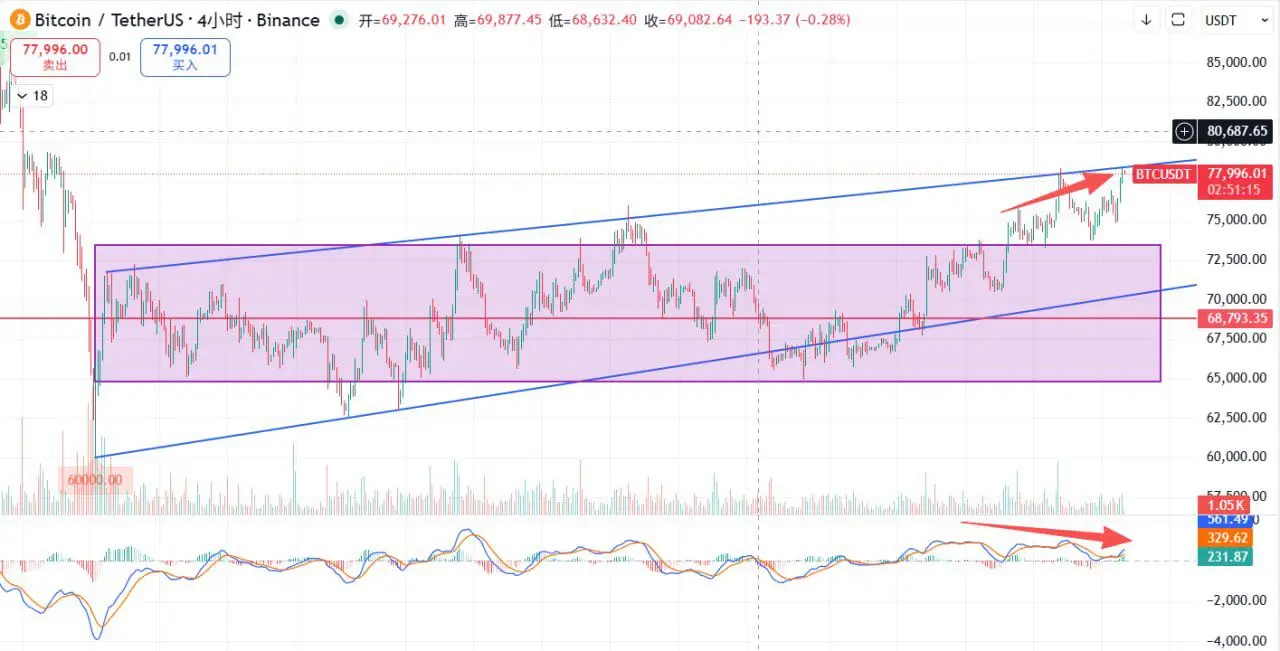
After Bitcoin first touched the 78,000 pressure level, it quickly pulled back. However, due to the strong performance of US stocks, it did not show a smooth selloff. It rebounded at the 74,000 support level (after the previous box-top resistance was broken, it turned into support). It has now broken through the previous rebound high of 78,333; the highest reached was 78,452, forming a small upper wick.
Overall, Bitcoin has come again to the upper edge of the flag pattern. We have mentioned this level repeatedly, and
ETH1.05%
BTC1.02%
View Original
post-image
post-image
  • Reward
  • Comment
  • Repost
  • Share
  • Pinned