SunshineAndGreatAmbitionsAhead

vip
Active for: 0.2y
Peak Tier 1
No content yet
Opportunity is something that fixes people who can’t decide
More or less the same skills
It’s a matter of who dares more
The bold get to eat the meat
The timid can’t even get a taste of the soup
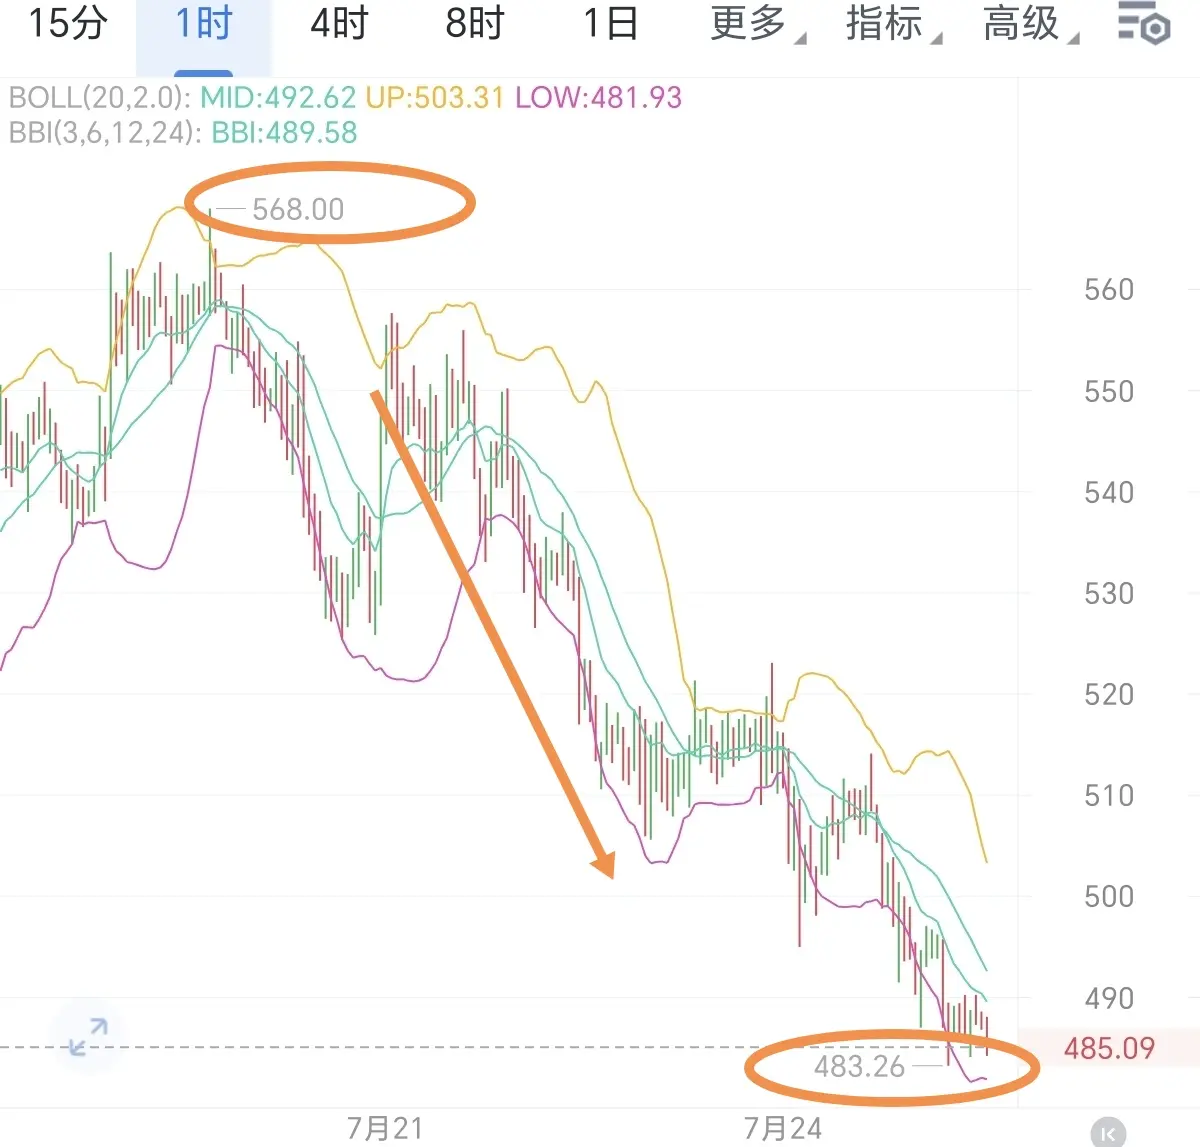
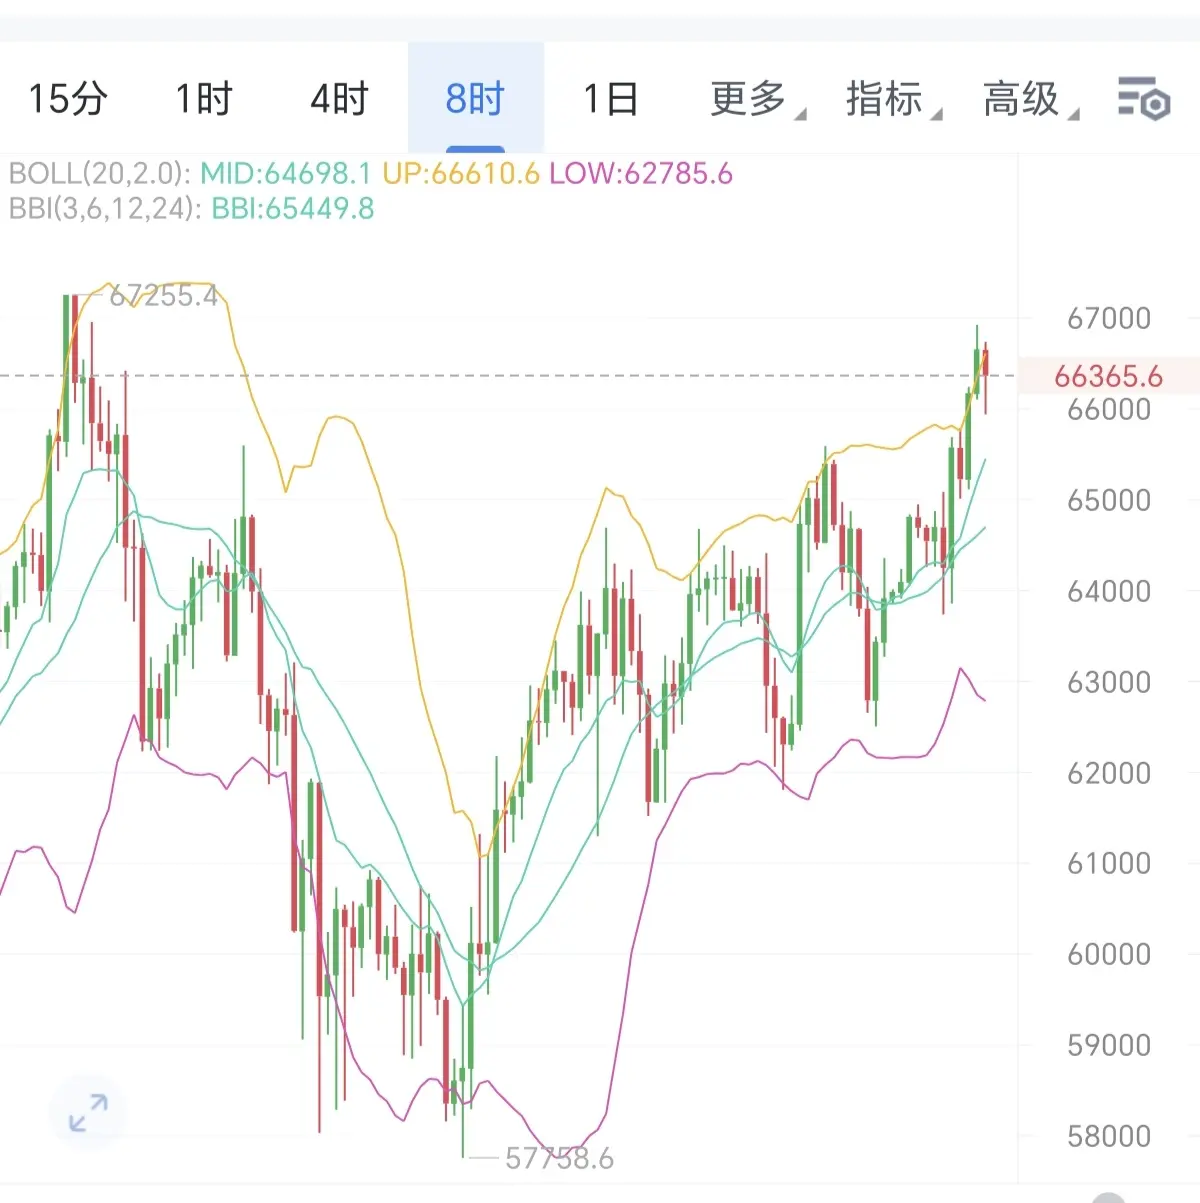
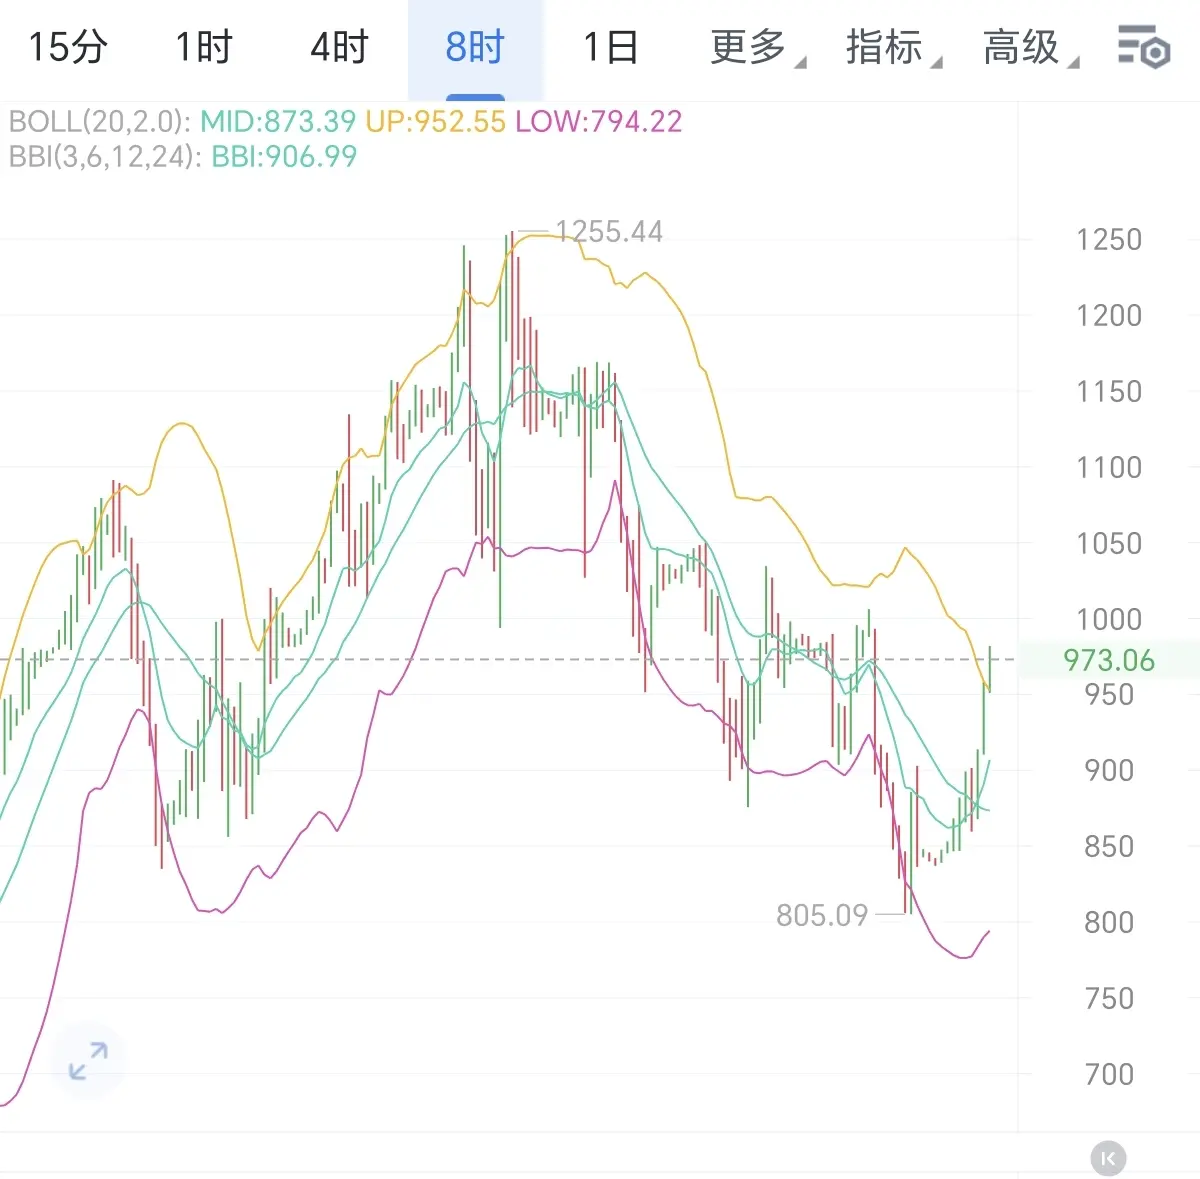
With ZEC’s position and direction laid out clearly, the bearish move has already opened up an 80-point space—while you’re still hesitating, others are already eating the big meat$BTC $ZEC #直通IPO第二期JerseyMikes
BTC-2.37%
ZEC-5.94%
View Original
post-image
post-image
  • Reward
  • Comment
  • Repost
  • Share
How to fix it if you’re stuck in a losing position?
Many friends have been deeply trapped by a sudden downturn. In fact, getting caught in a bad trade is unavoidable for anyone— the key is learning the right way to self-rescue.
Never “hold and hope.” Risking it by stubbornly hard-holding one hundred times is still just one case where a one-way drop triggers liquidation. Then all past profits will be wiped out to zero. Being stuck in a losing position isn’t the real problem; what’s scary is holding onto fantasies, refusing to cut losses, and not knowing when to make timely decisions. Reducing e
BTC-2.37%
ETH-1.80%
View Original
post-image
  • Reward
  • Comment
  • Repost
  • Share
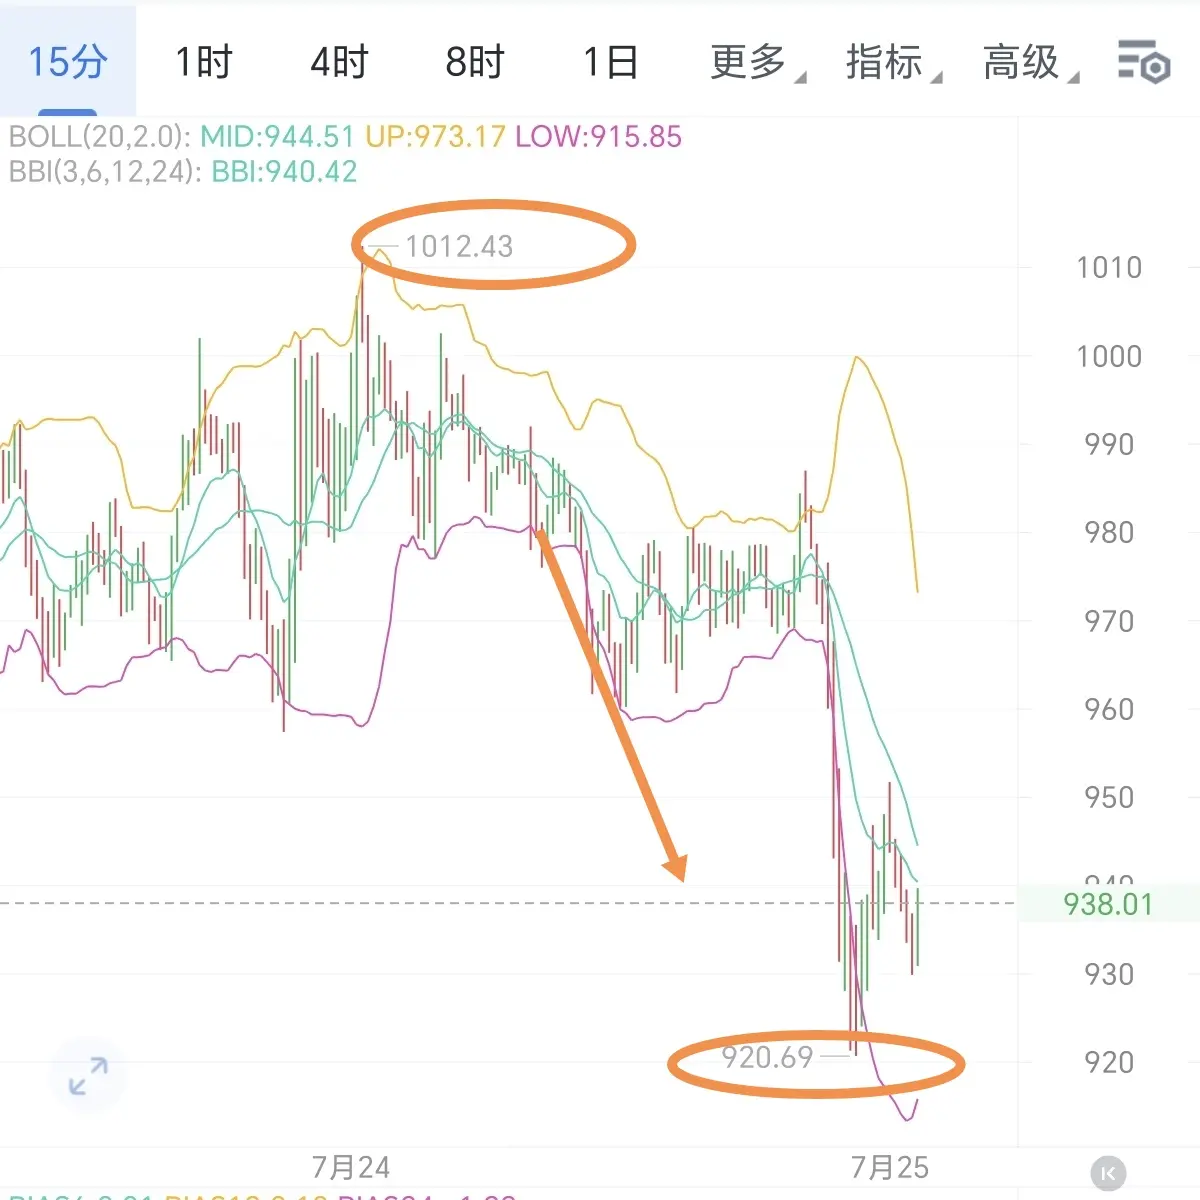
A tale of chasing found money, aimed at the scorching-sun Silk Road; MU Micron remains as beautiful as ever. Going bearish to capture 90 points of room, then straight up to the market’s ceiling. $BTC $ETH #直通IPO第二期JerseyMikes
BTC-2.37%
ETH-1.80%
View Original
post-image
post-image
  • Reward
  • Comment
  • Repost
  • Share
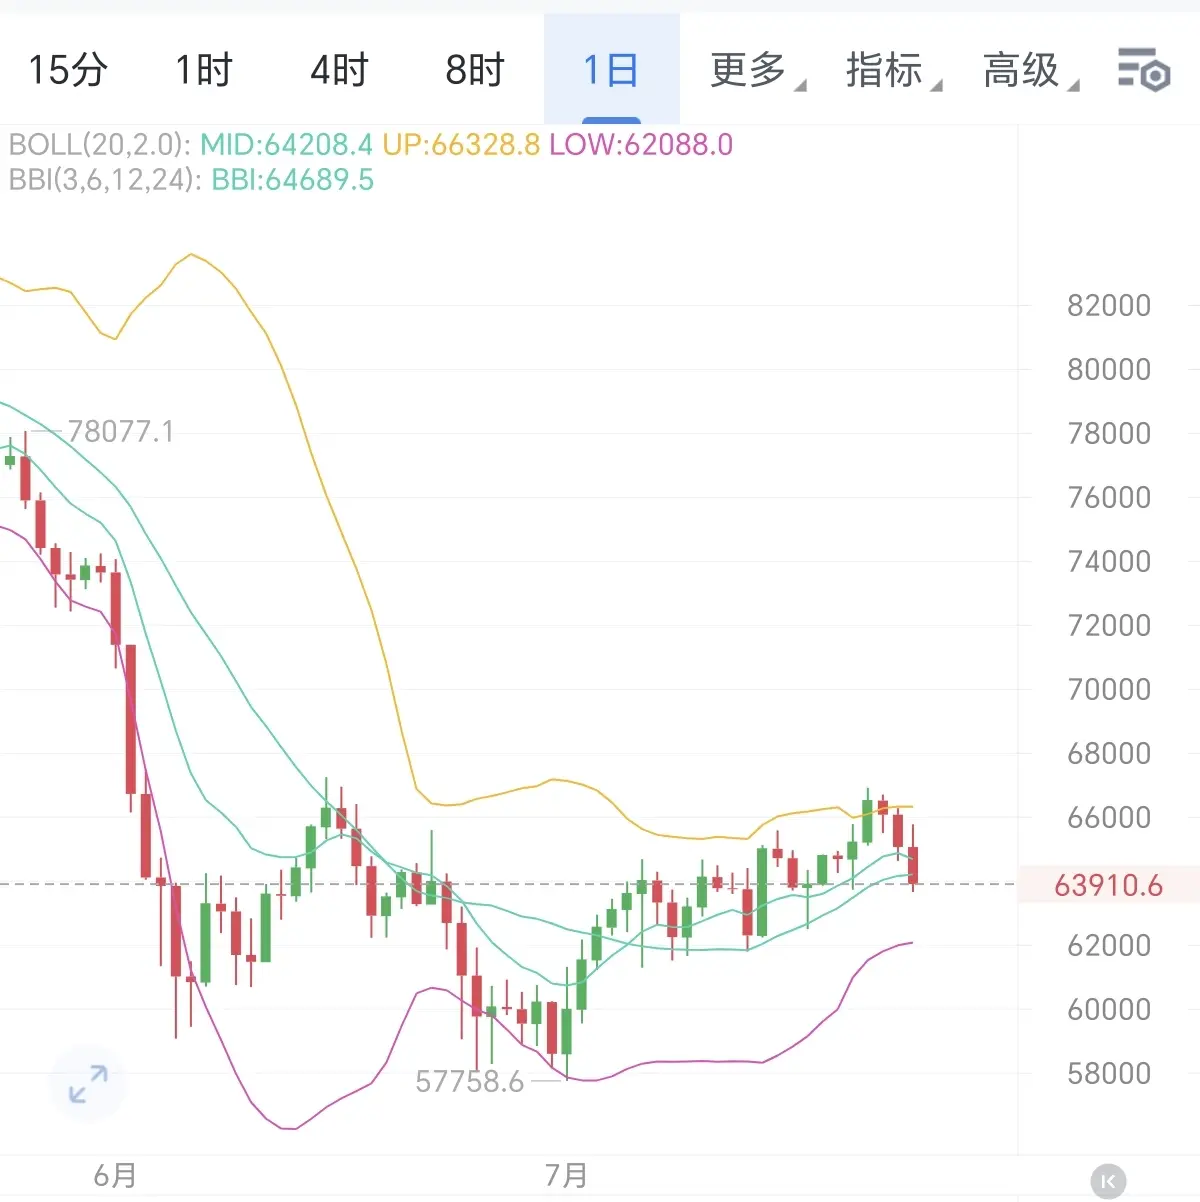
How should BTC be positioned next week?
1. On the daily and 4-hour charts, the lows continue to rise. Stepwise support keeps moving up, and every deep pullback is quickly reclaimed with no ground lost. The bulls show strong follow-through, forming a standard uptrend range-trading breakout-and-pullback (washing) structure.

2. The moving averages gradually turn upward. During pullbacks, volume shrinks, while during rebounds, volume expands. Volume and price action are healthy together. The short-term consolidation is only a continuation of the rally and will not reverse the long- and mid-term
BTC-2.37%
ETH-1.80%
View Original
post-image
post-image
  • Reward
  • 1
  • Repost
  • Share
Let'sAllEarnMoneyTogether:
Awesome class
Afternoon BTC Analysis
From the 4-hour chart, 65,800 is the first short-term resistance, and 66,300 is the secondary strong resistance. Price has repeatedly probed upward into these zones; upward momentum continues to shrink. Whenever it tries to push higher, it frequently meets heavy pressure, fails, and pulls back. Swing highs gradually move lower, forming a multi-layer top-pressure structure.
The indicators show a volume-price top divergence: the RSI turns down from a high level, and the MACD red histogram continues to shrink. Bullish attack momentum is being continuously consumed. At t
BTC-2.37%
ETH-1.80%
View Original
post-image
  • Reward
  • Comment
  • Repost
  • Share
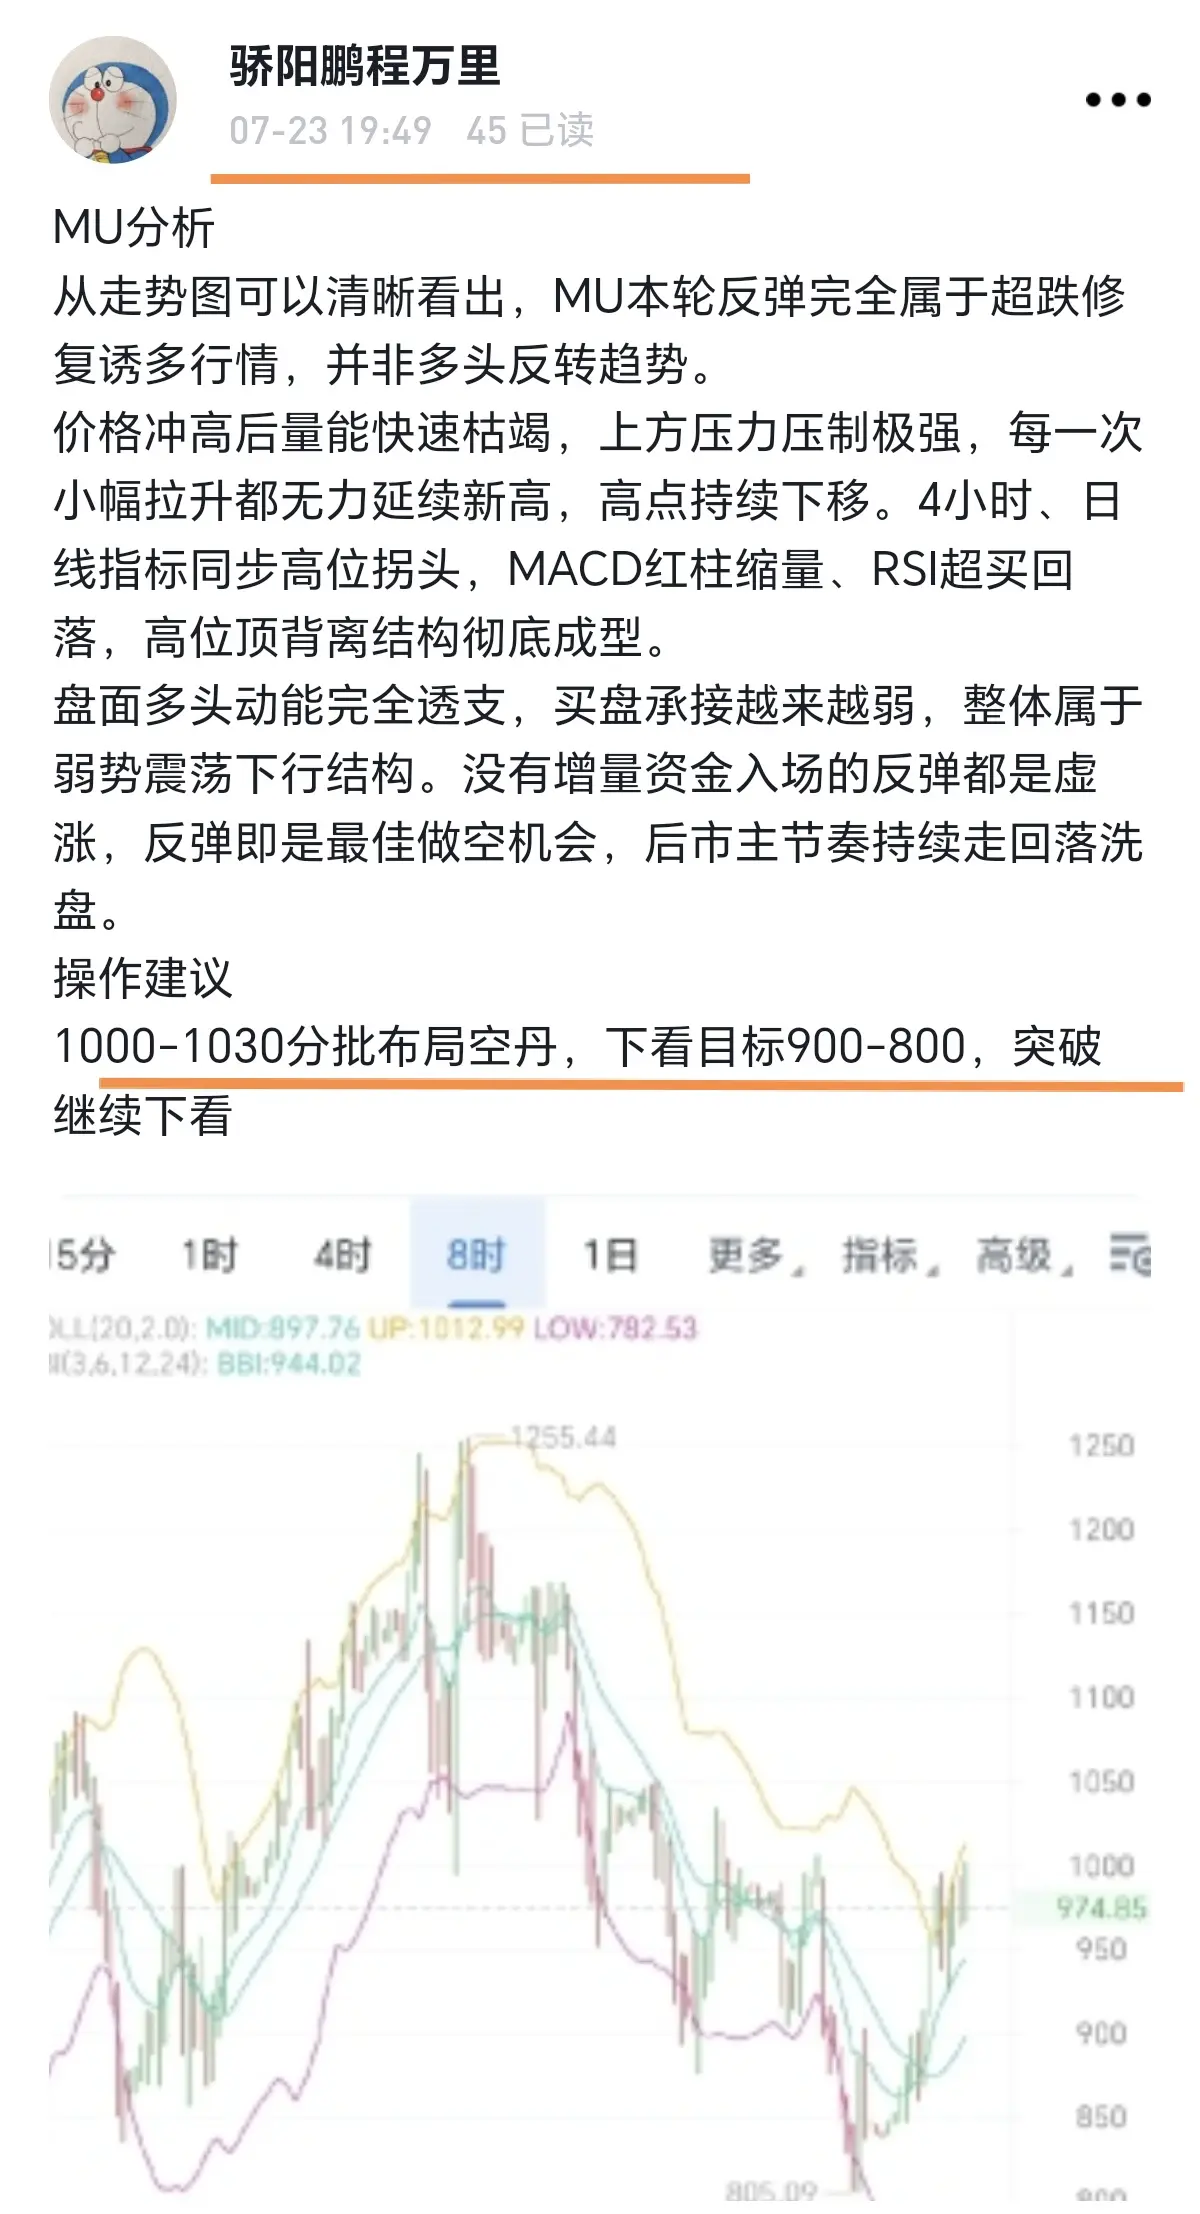
MU analysis
From the chart, it is clearly evident that MU’s current rebound is entirely an oversold-rebound and stop-hunt pattern, not a bullish reversal trend.
After the price spikes upward, volume quickly dries up; overhead resistance is extremely strong. Every time there’s a modest push higher, it lacks the strength to continue making new highs, and the local highs keep trending lower. The 4-hour and daily indicators both turn from high levels: the MACD red histogram shrinks, the RSI rolls over from overbought, and the bearish top-divergence structure has fully formed.
The market’s bullish
BTC-2.37%
MU-5.16%
View Original
post-image
  • Reward
  • Comment
  • Repost
  • Share
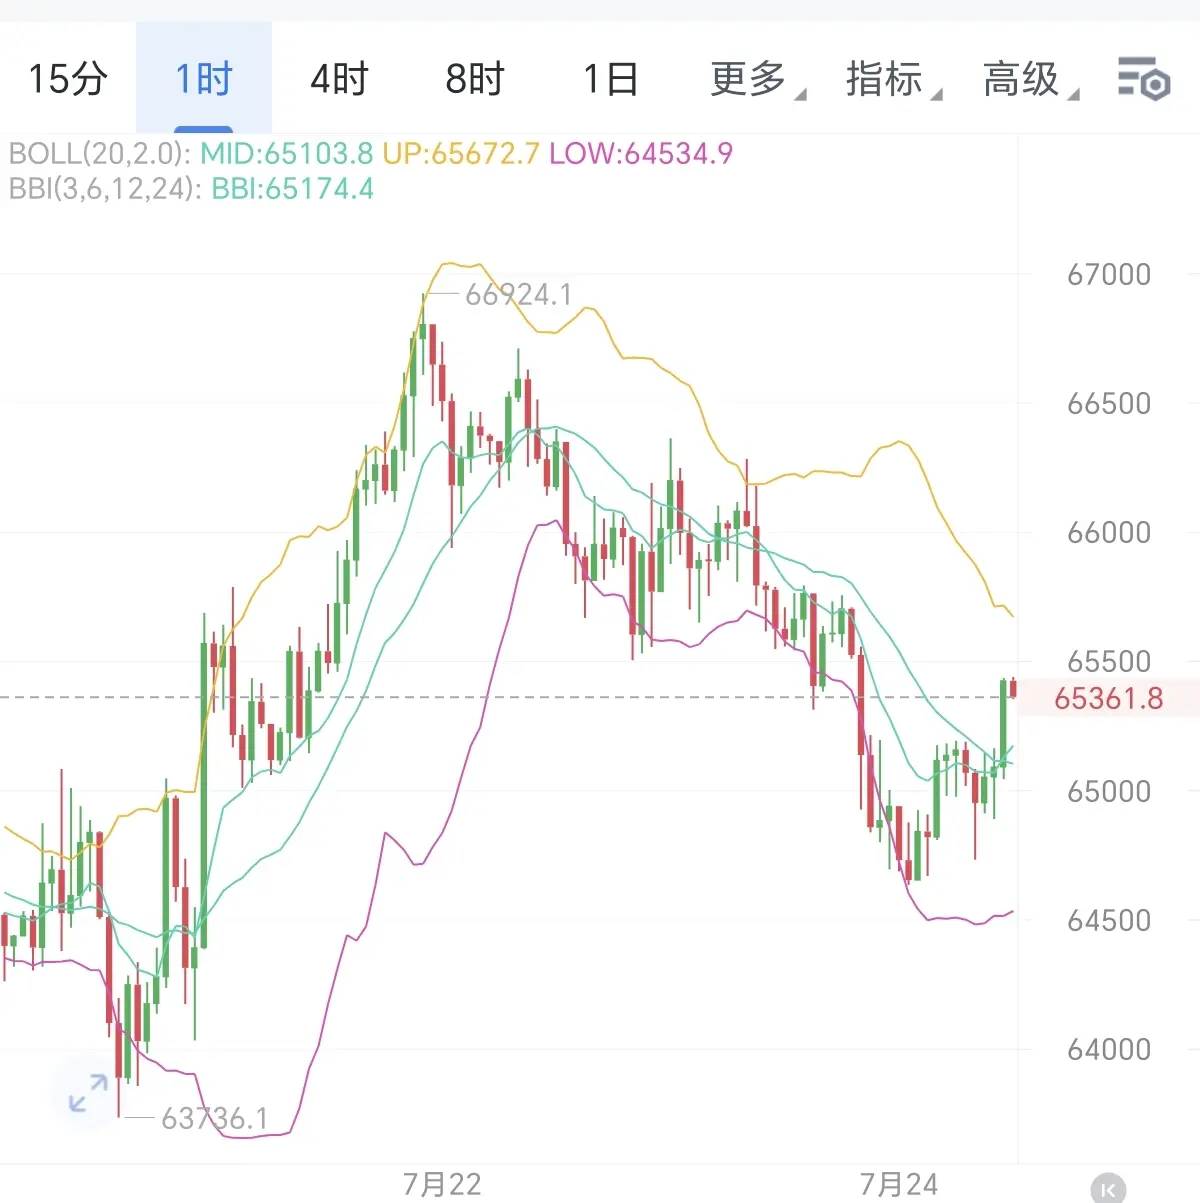
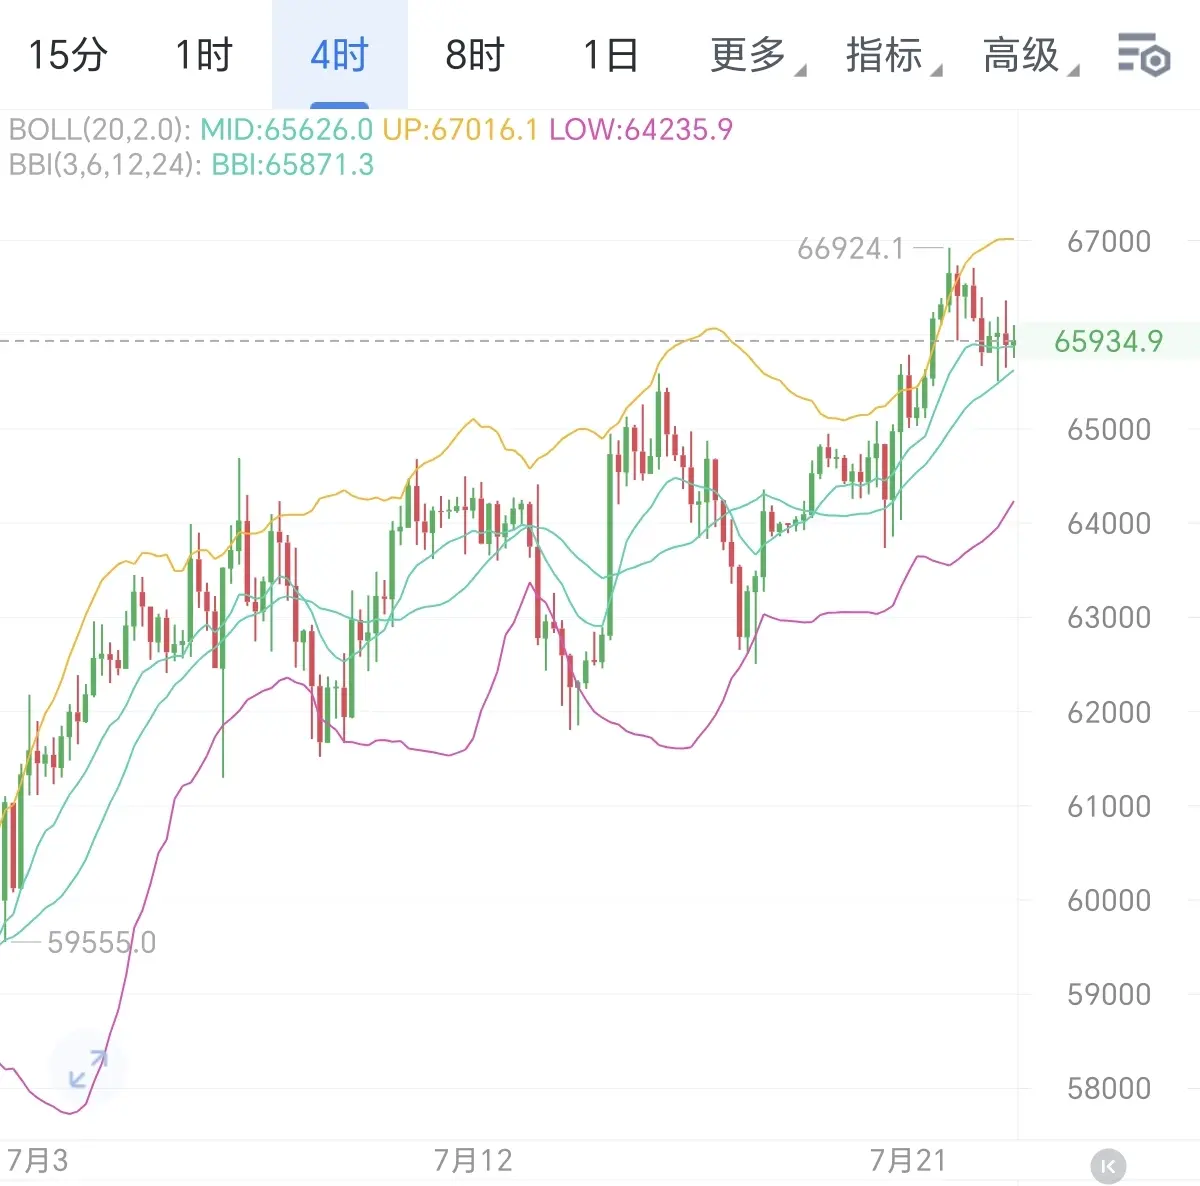
Is the big move at 67,000 a temporary top?
The chart’s resistance is clear: 66,300, 66,800, with strong resistance at 67,200; support at 64,500, 64,800.
Only a volume breakout above 67,200 can continue the uptrend; the short-term bias for going short at high levels is unchanged for now.
Place short positions at 66,500-67,000, with targets around 65,500-65,000, and set the stop-loss above 67,350$BTC $ETH #Gate事件合约首发狂欢
BTC-2.37%
ETH-1.80%
View Original
post-image
  • Reward
  • 2
  • Repost
  • Share
BigWhiteA:
Got it, got it 😀
View More
Clear and well-structured, with a clear purpose—how could anyone not be captivated by Silk Road-style operations like this?
A 3,000-point space in two days, a god-level plan—so are you guys happy about this fans’ reward or not? $BTC $ETH #Gate事件合约首发狂欢
BTC-2.37%
ETH-1.80%
View Original
post-image
post-image
post-image
  • Reward
  • Comment
  • Repost
  • Share
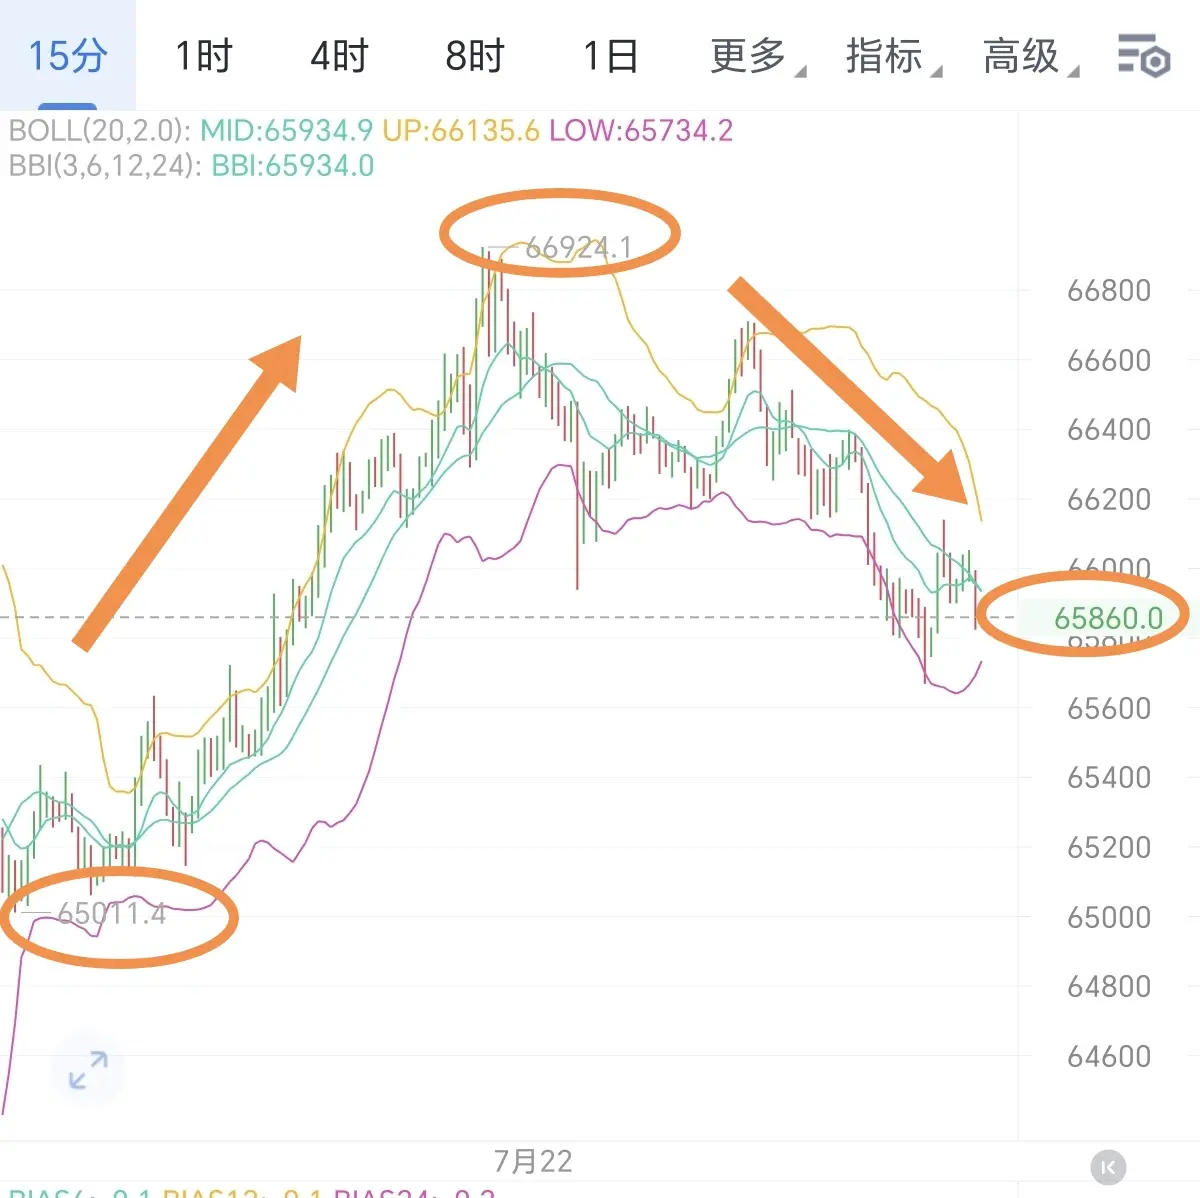
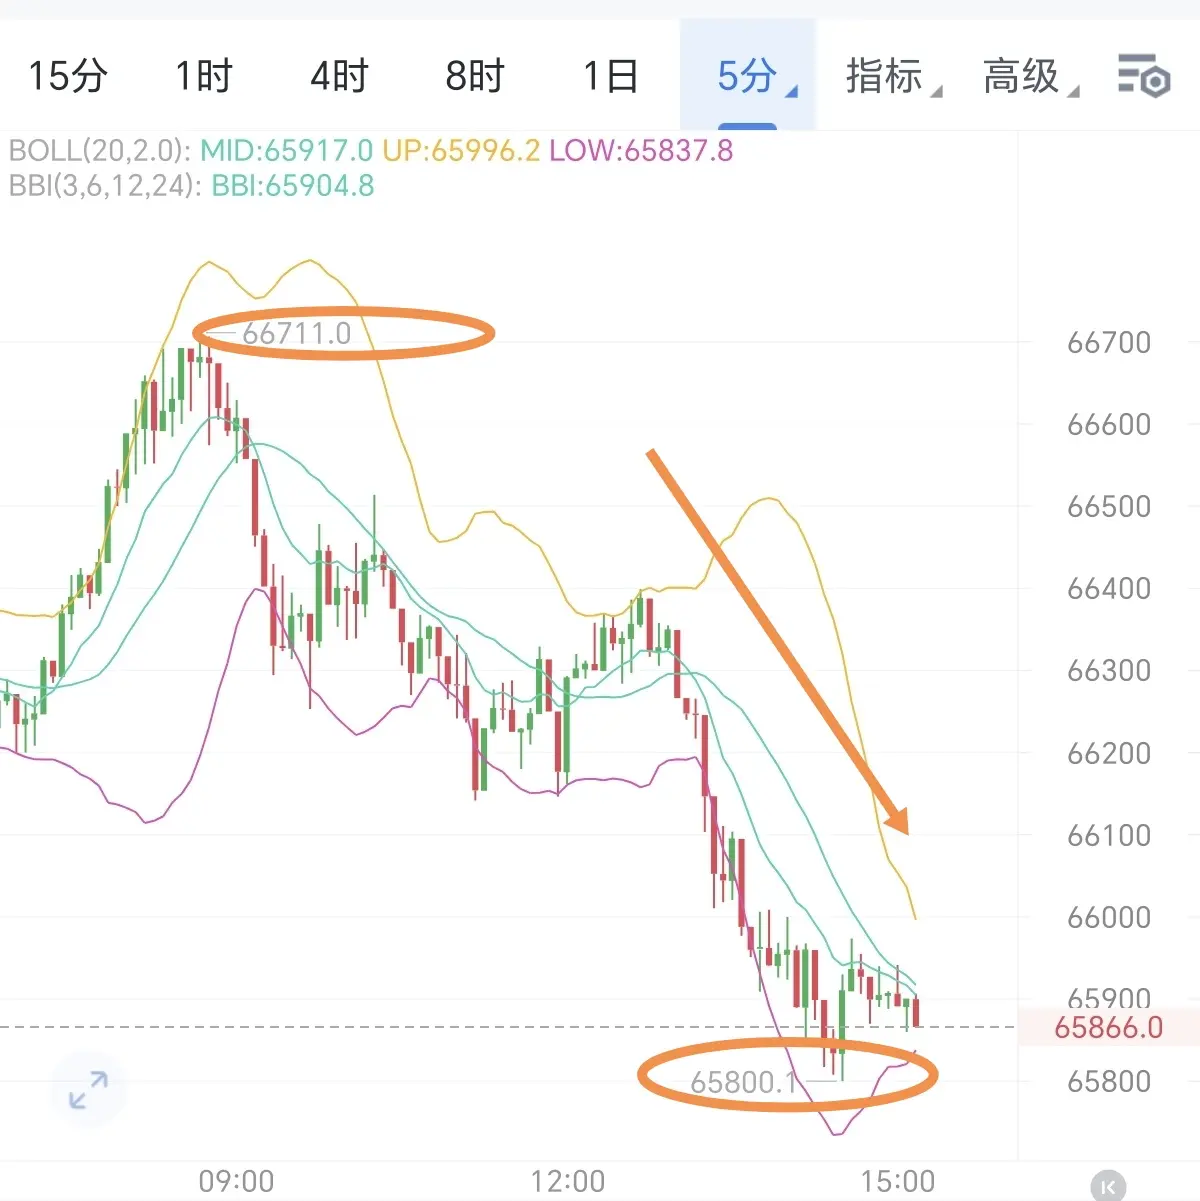
Wavering left and right will only make you lose your bearings. Getting hit on both sides is less effective than leaning against a big tree for shade—having a clear Silk Road is better than relying on your own instincts to crash into a wall.
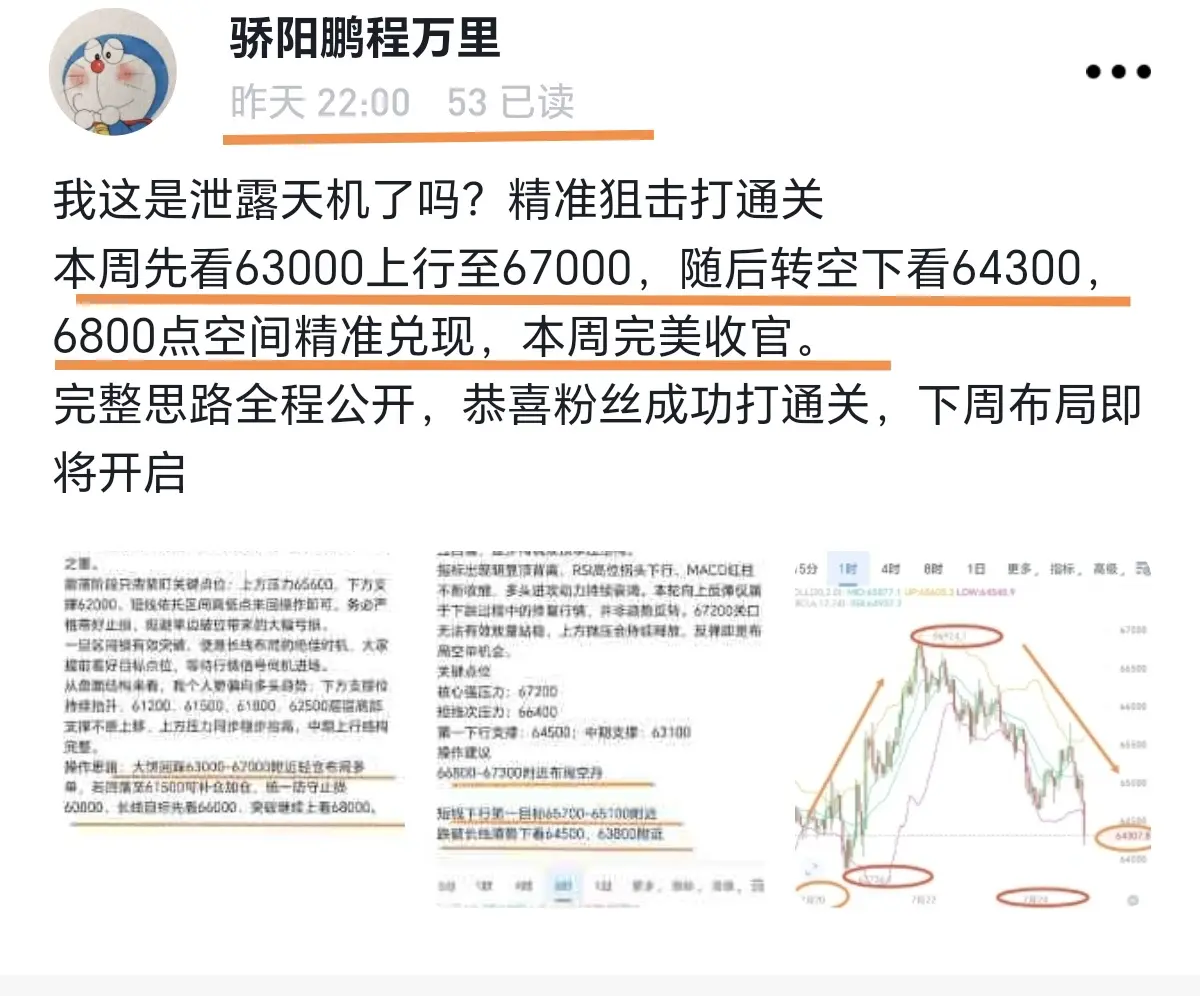
The “big pie” is looking bearish on the Silk Road and the move is being realized, with a 900-point range.
For you with exceptionally strong execution: the direction remains unchanged—today we’ll keep focusing mainly on taking shorts on rebounds.
BTC-2.39%
View Original
post-image
post-image
  • Reward
  • Comment
  • Repost
  • Share
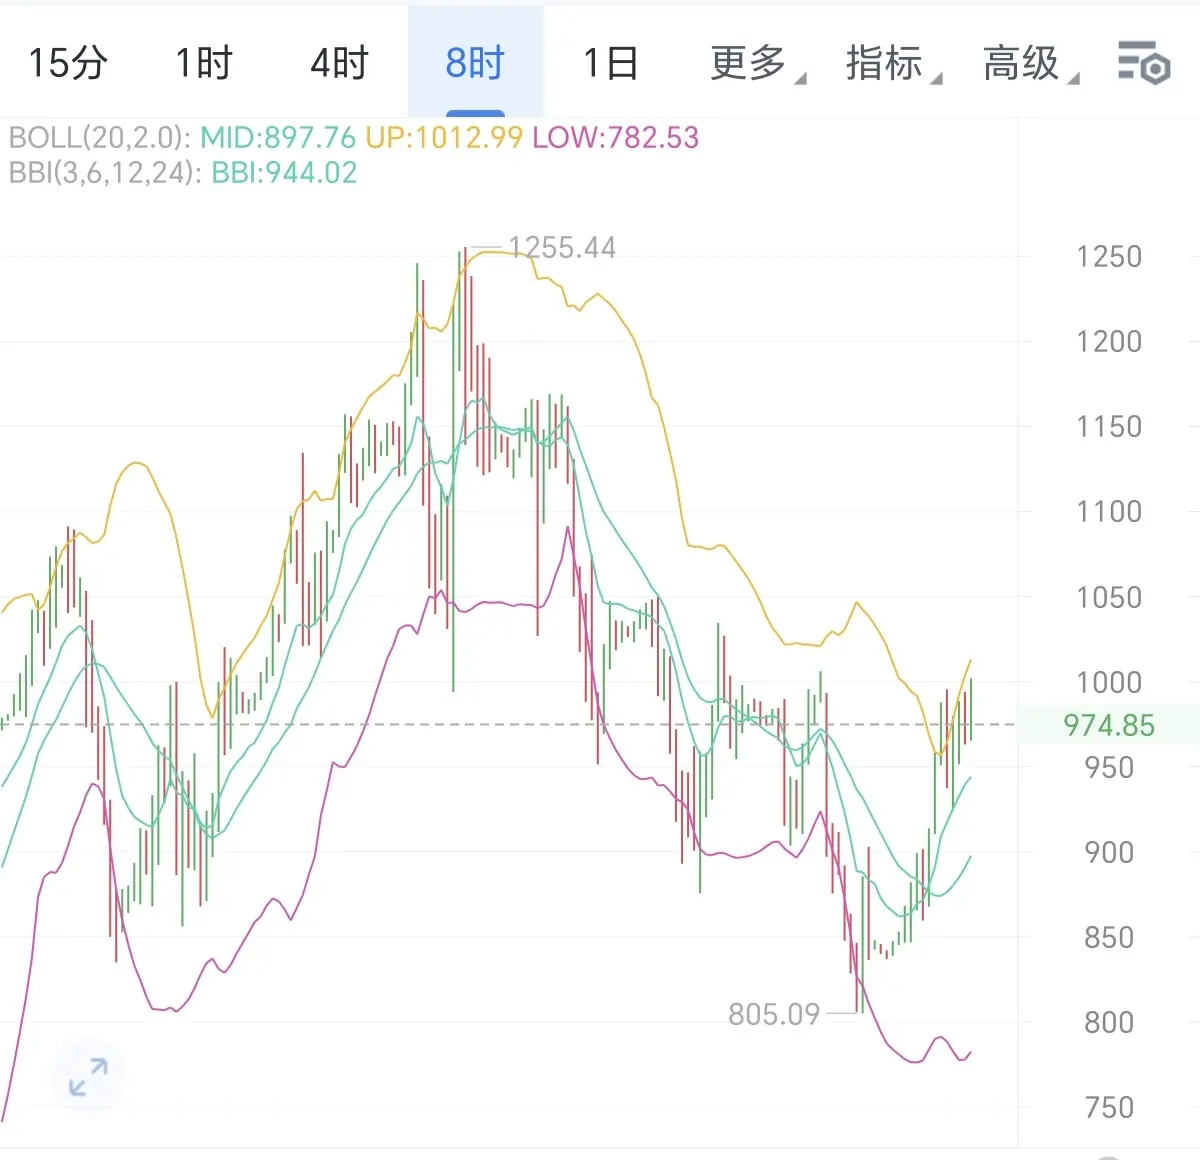
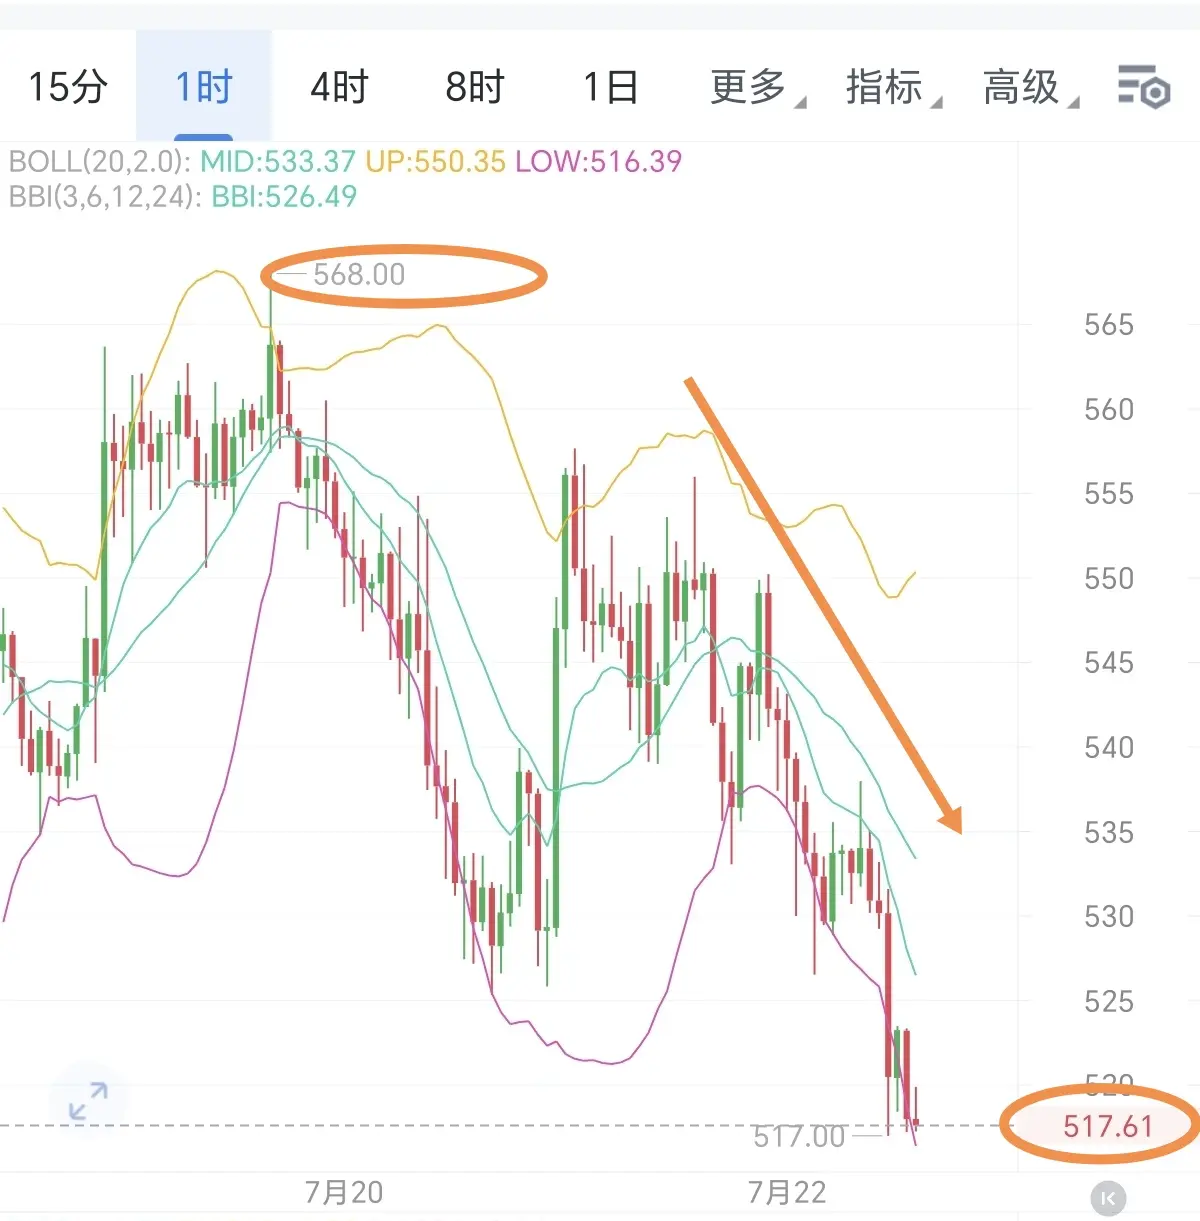
ZEC is bearish on Silk Road and the decline is being realized; it has already opened up 50 points of room. For the short term, you can manage your position on your own; for the long term, you can continue to hold. Continue to look for downside at $BTC $ETH #特朗普同意Clarity法案纳入伦理条款
BTC-2.37%
ETH-1.80%
View Original
post-image
post-image
  • Reward
  • Comment
  • Repost
  • Share
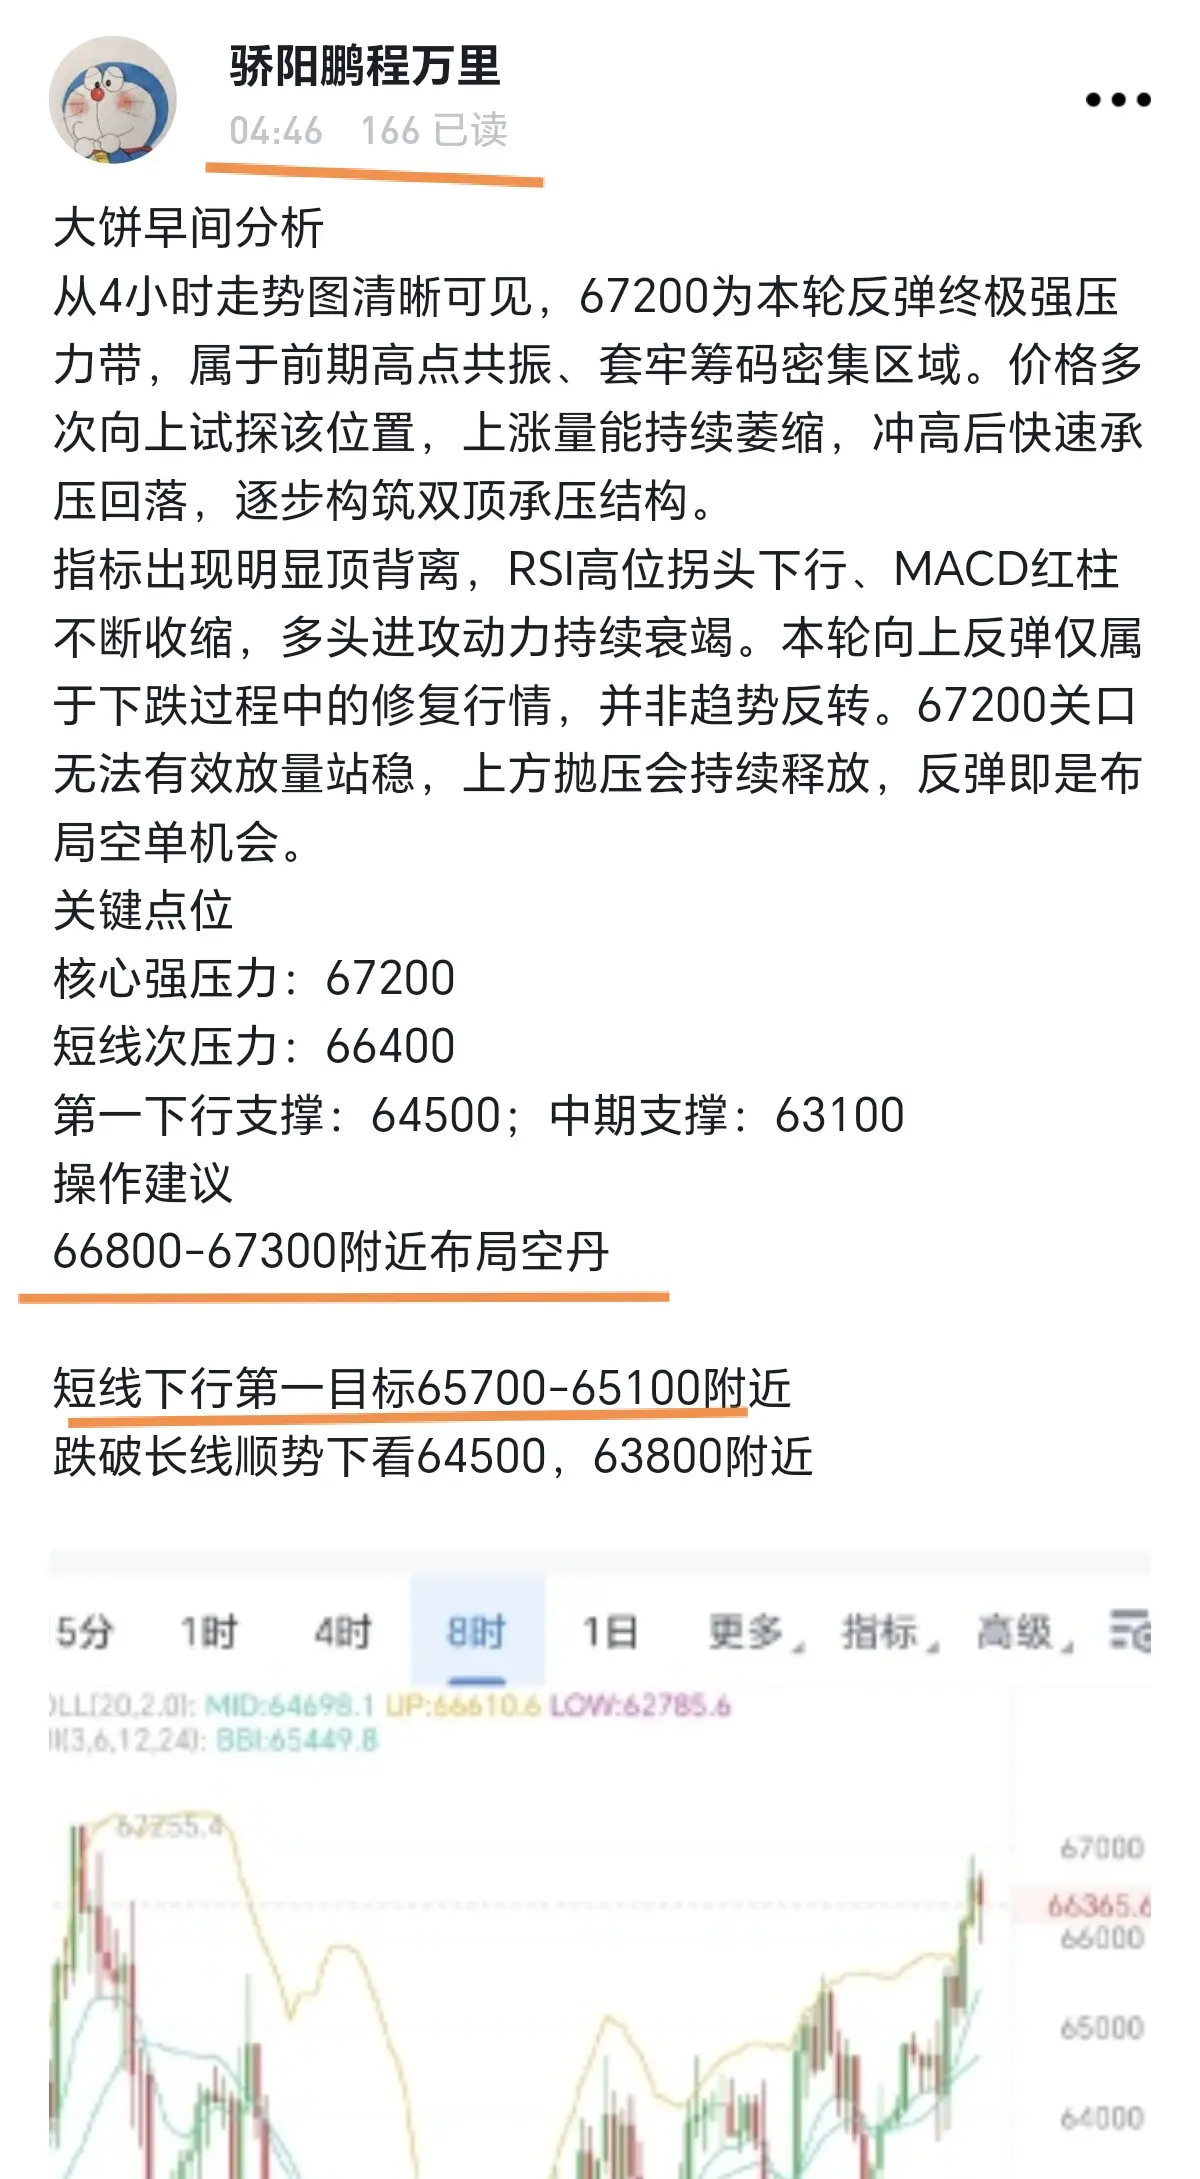
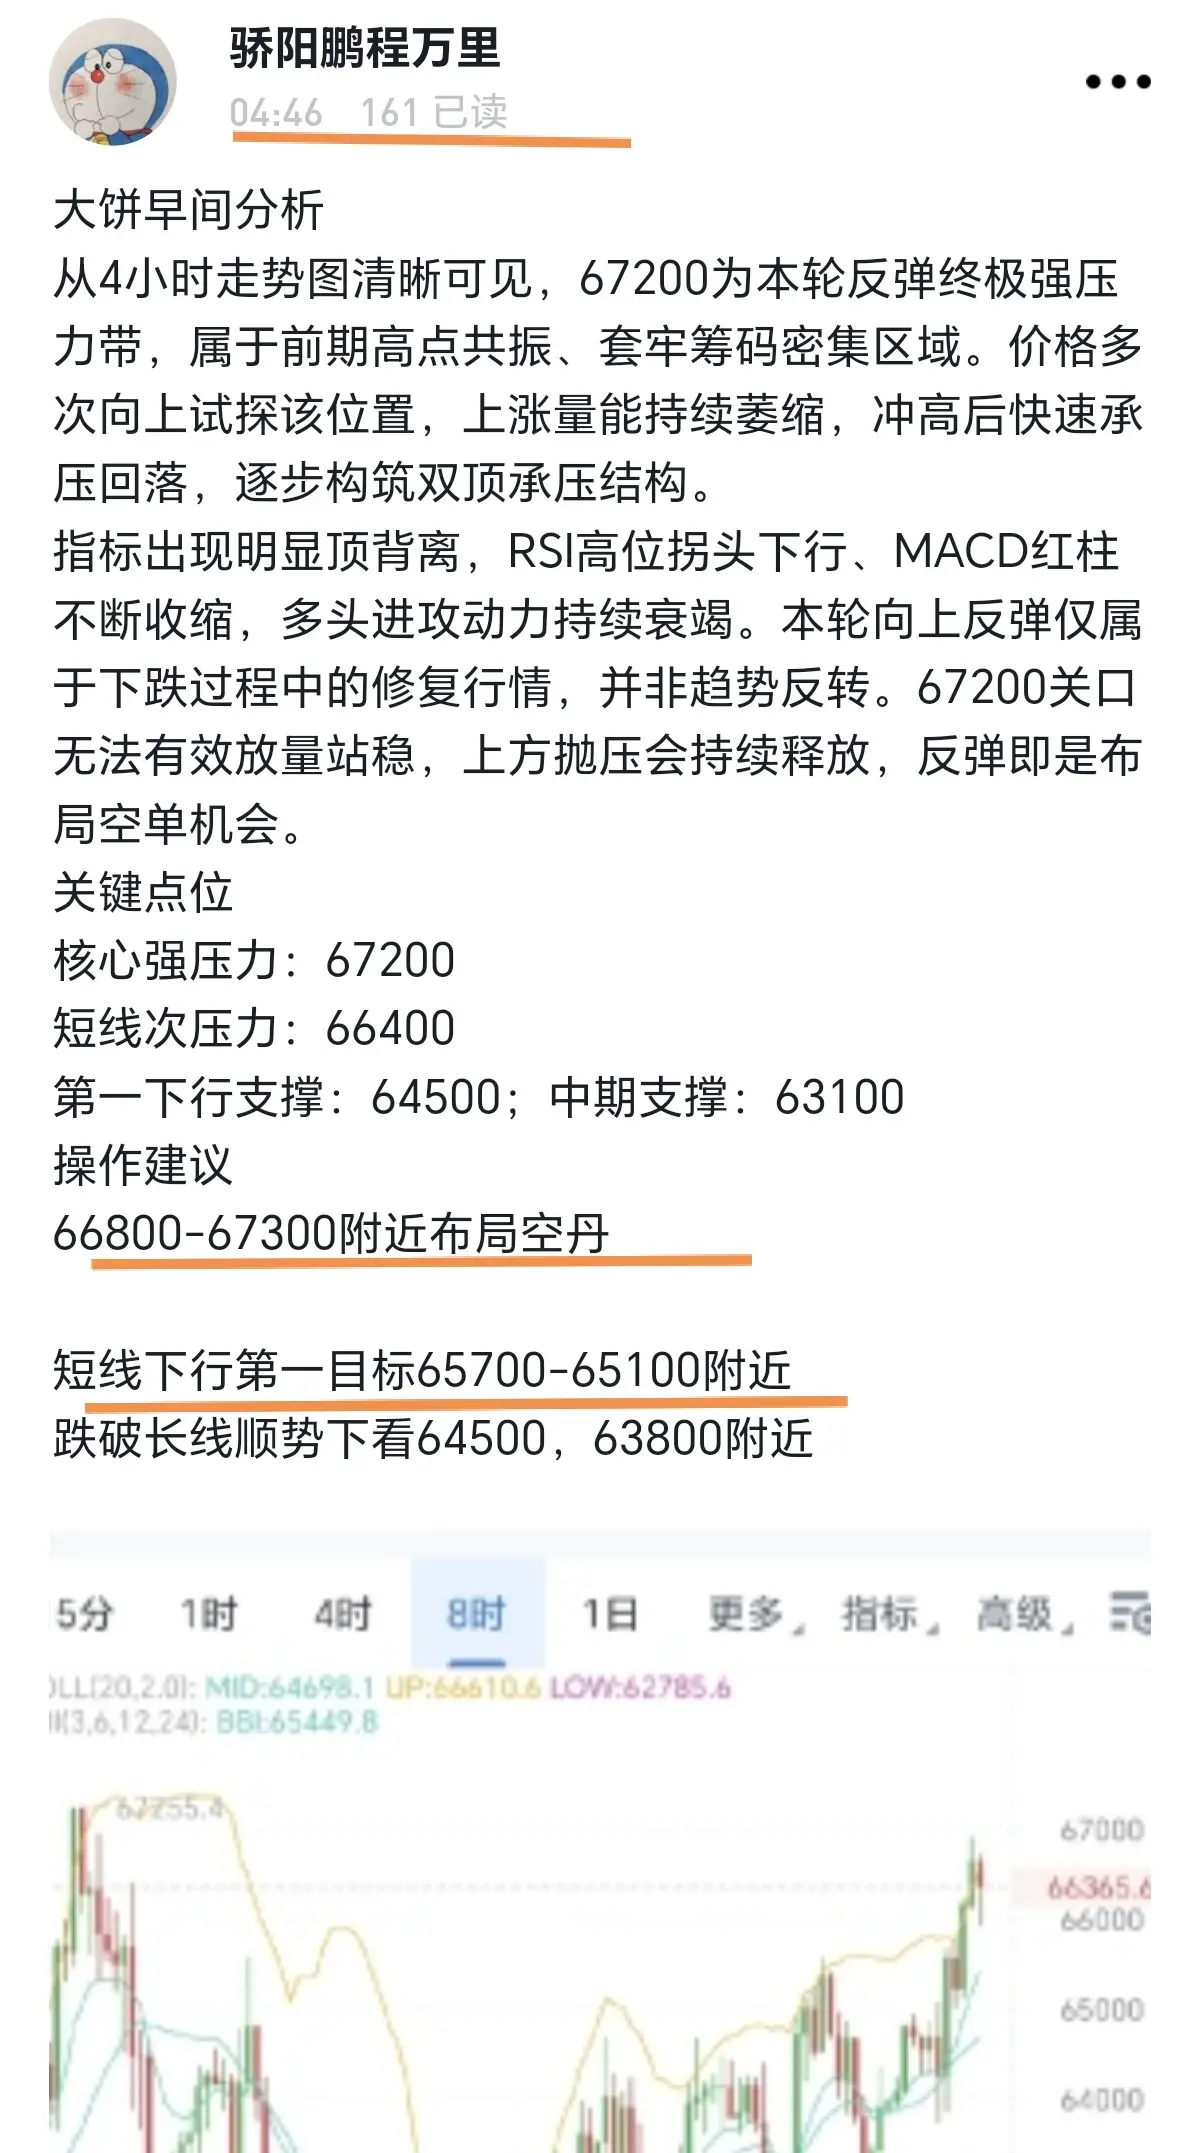
BTC morning analysis
From the 4-hour chart, it is clear that 67,200 is the ultimate strong pressure zone of this rebound, formed by prior swing highs and a highly concentrated area of trapped liquidity. The price has repeatedly probed upward toward this level; while the upward momentum keeps shrinking, it quickly faced pressure and fell back after spiking, gradually forming a double-top bearish pressure structure.
Indicators show a clear bearish divergence: RSI turns down from overbought levels, and the MACD red histogram continues to shrink—bullish attack momentum keeps weakening. This upward
BTC-2.37%
View Original
post-image
  • Reward
  • Comment
  • Repost
  • Share
MU Analysis
From the recent price chart, it is clear that MU’s current rebound is purely an oversold technical correction in this cycle, not a bullish reversal trend.
After a slight push higher, trading volume quickly dries up. The sell pressure above is extremely heavy. Every rebound fails to carry on and break to new highs; highs gradually move lower, and bullish attack momentum is completely insufficient.
In terms of indicators, both the 4-hour and daily timeframes are all dulled at high levels and have turned around. The MACD red histogram has shortened, RSI has fallen from overbought, and
BTC-2.37%
ETH-1.80%
View Original
post-image
  • Reward
  • Comment
  • Repost
  • Share
Evening BTC operation guide
The chart’s lows keep rising, with support levels moving up steadily; the moving averages are arranged in a bullish order, and bullish momentum is strong.
On pullbacks, buy in batches at the 65,700–65,300 range
Targets to watch are around 66,800–67,500$BTC $ETH #GUSD年化升至3.8%
BTC-2.37%
ETH-1.80%
View Original
post-image
  • Reward
  • Comment
  • Repost
  • Share
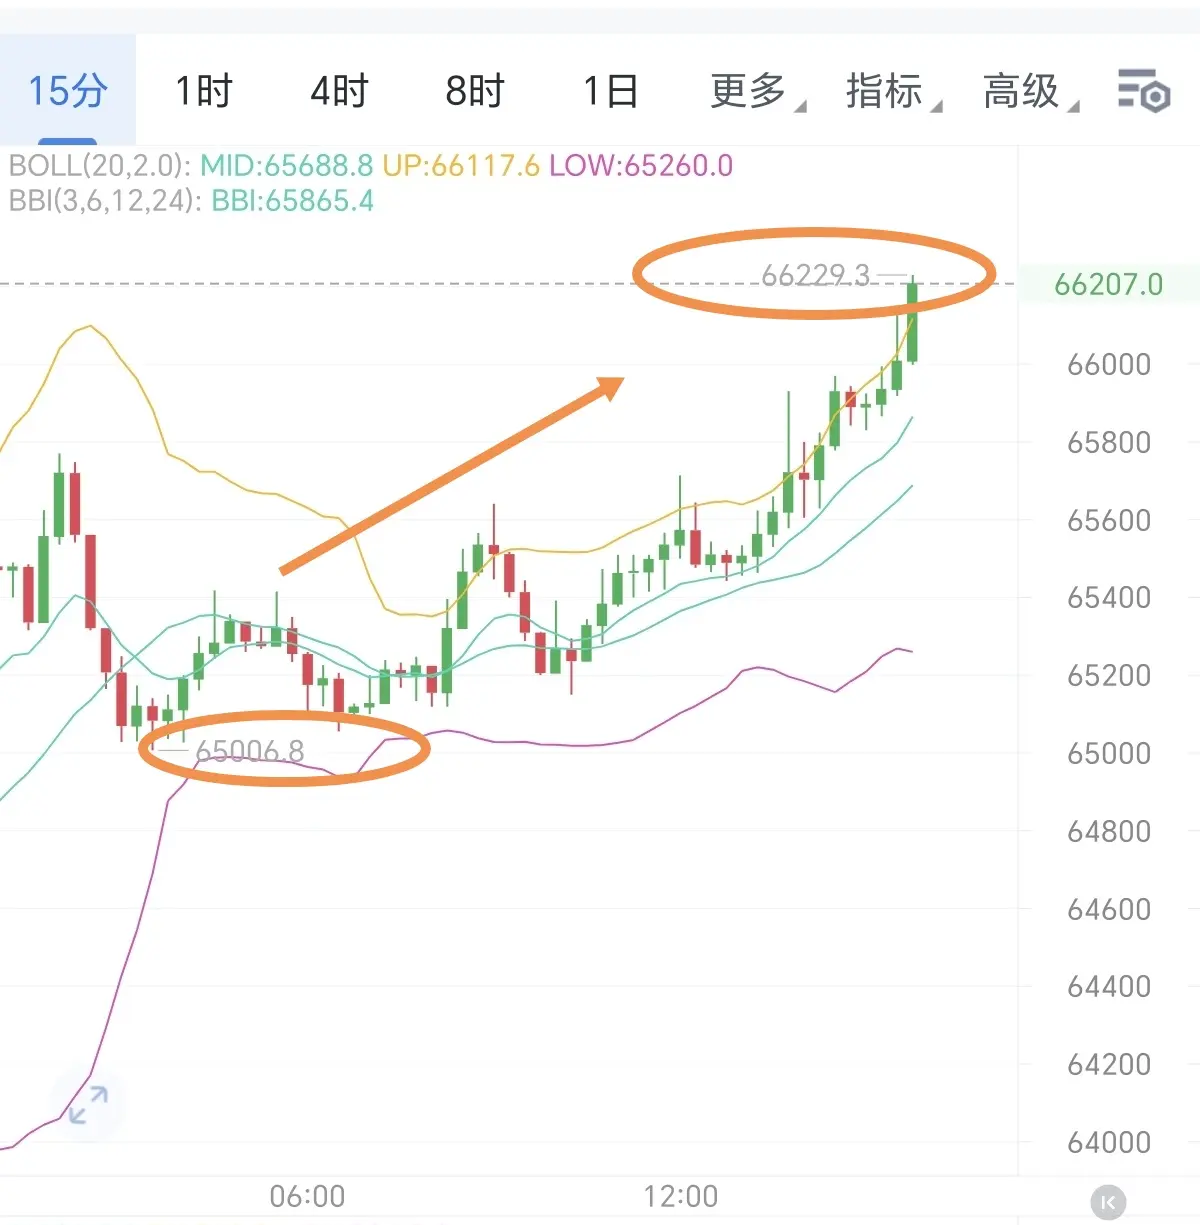
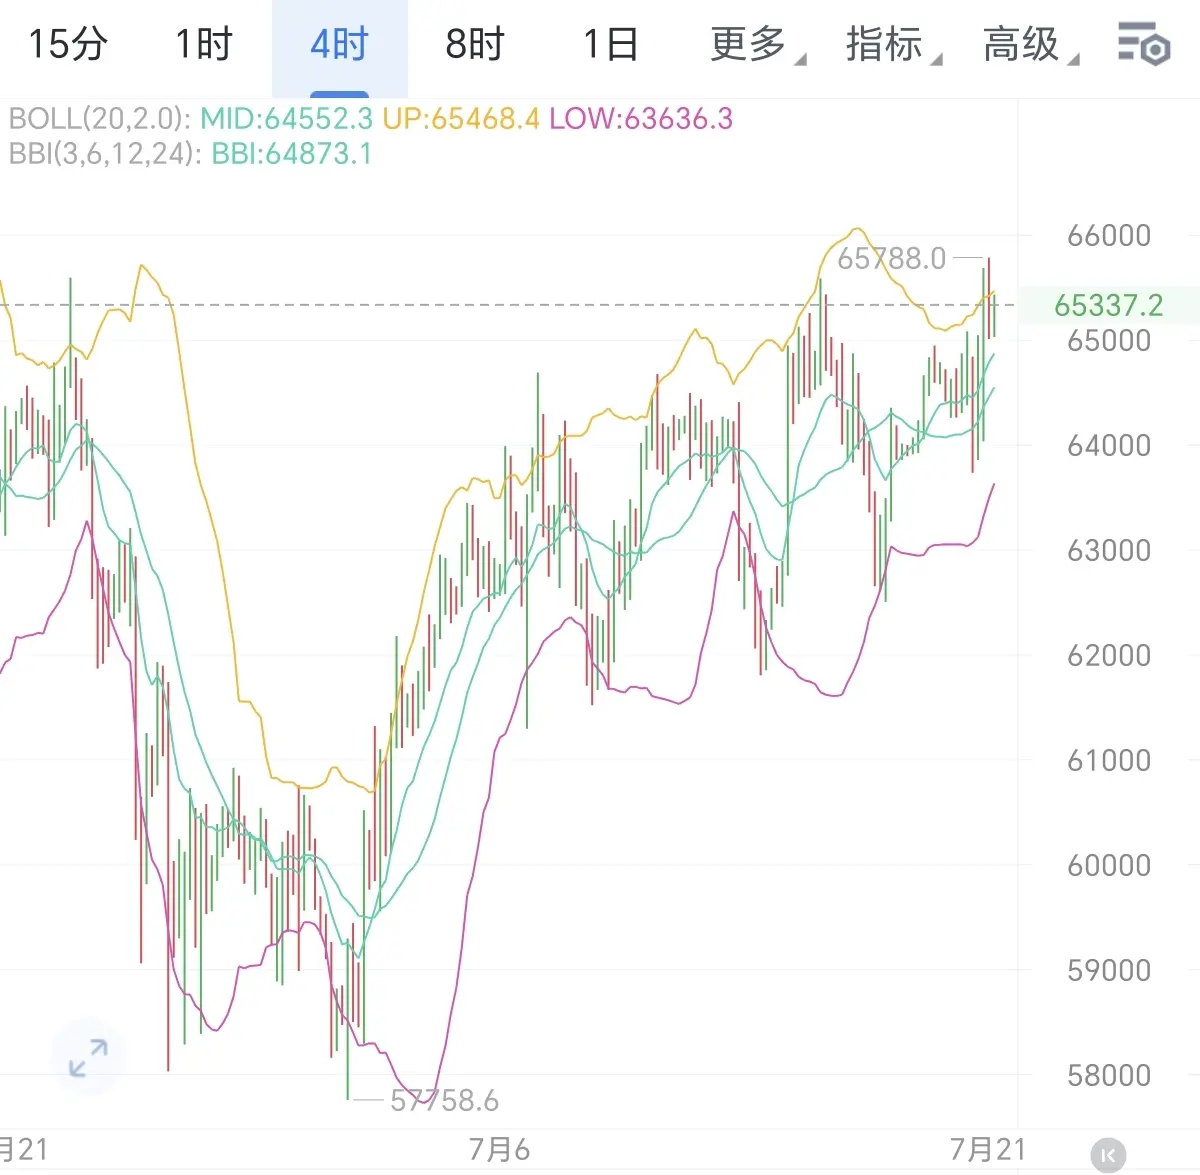
An early-morning temporary adjustment turned from short to long; everyone didn’t keep up in time. 66,200 has already been reached. Friends who adjusted in time have 1,000 points of room; you can manage $BTC that yourselves.
BTC-2.37%
ETH-1.80%
View Original
post-image
post-image
  • Reward
  • Comment
  • Repost
  • Share
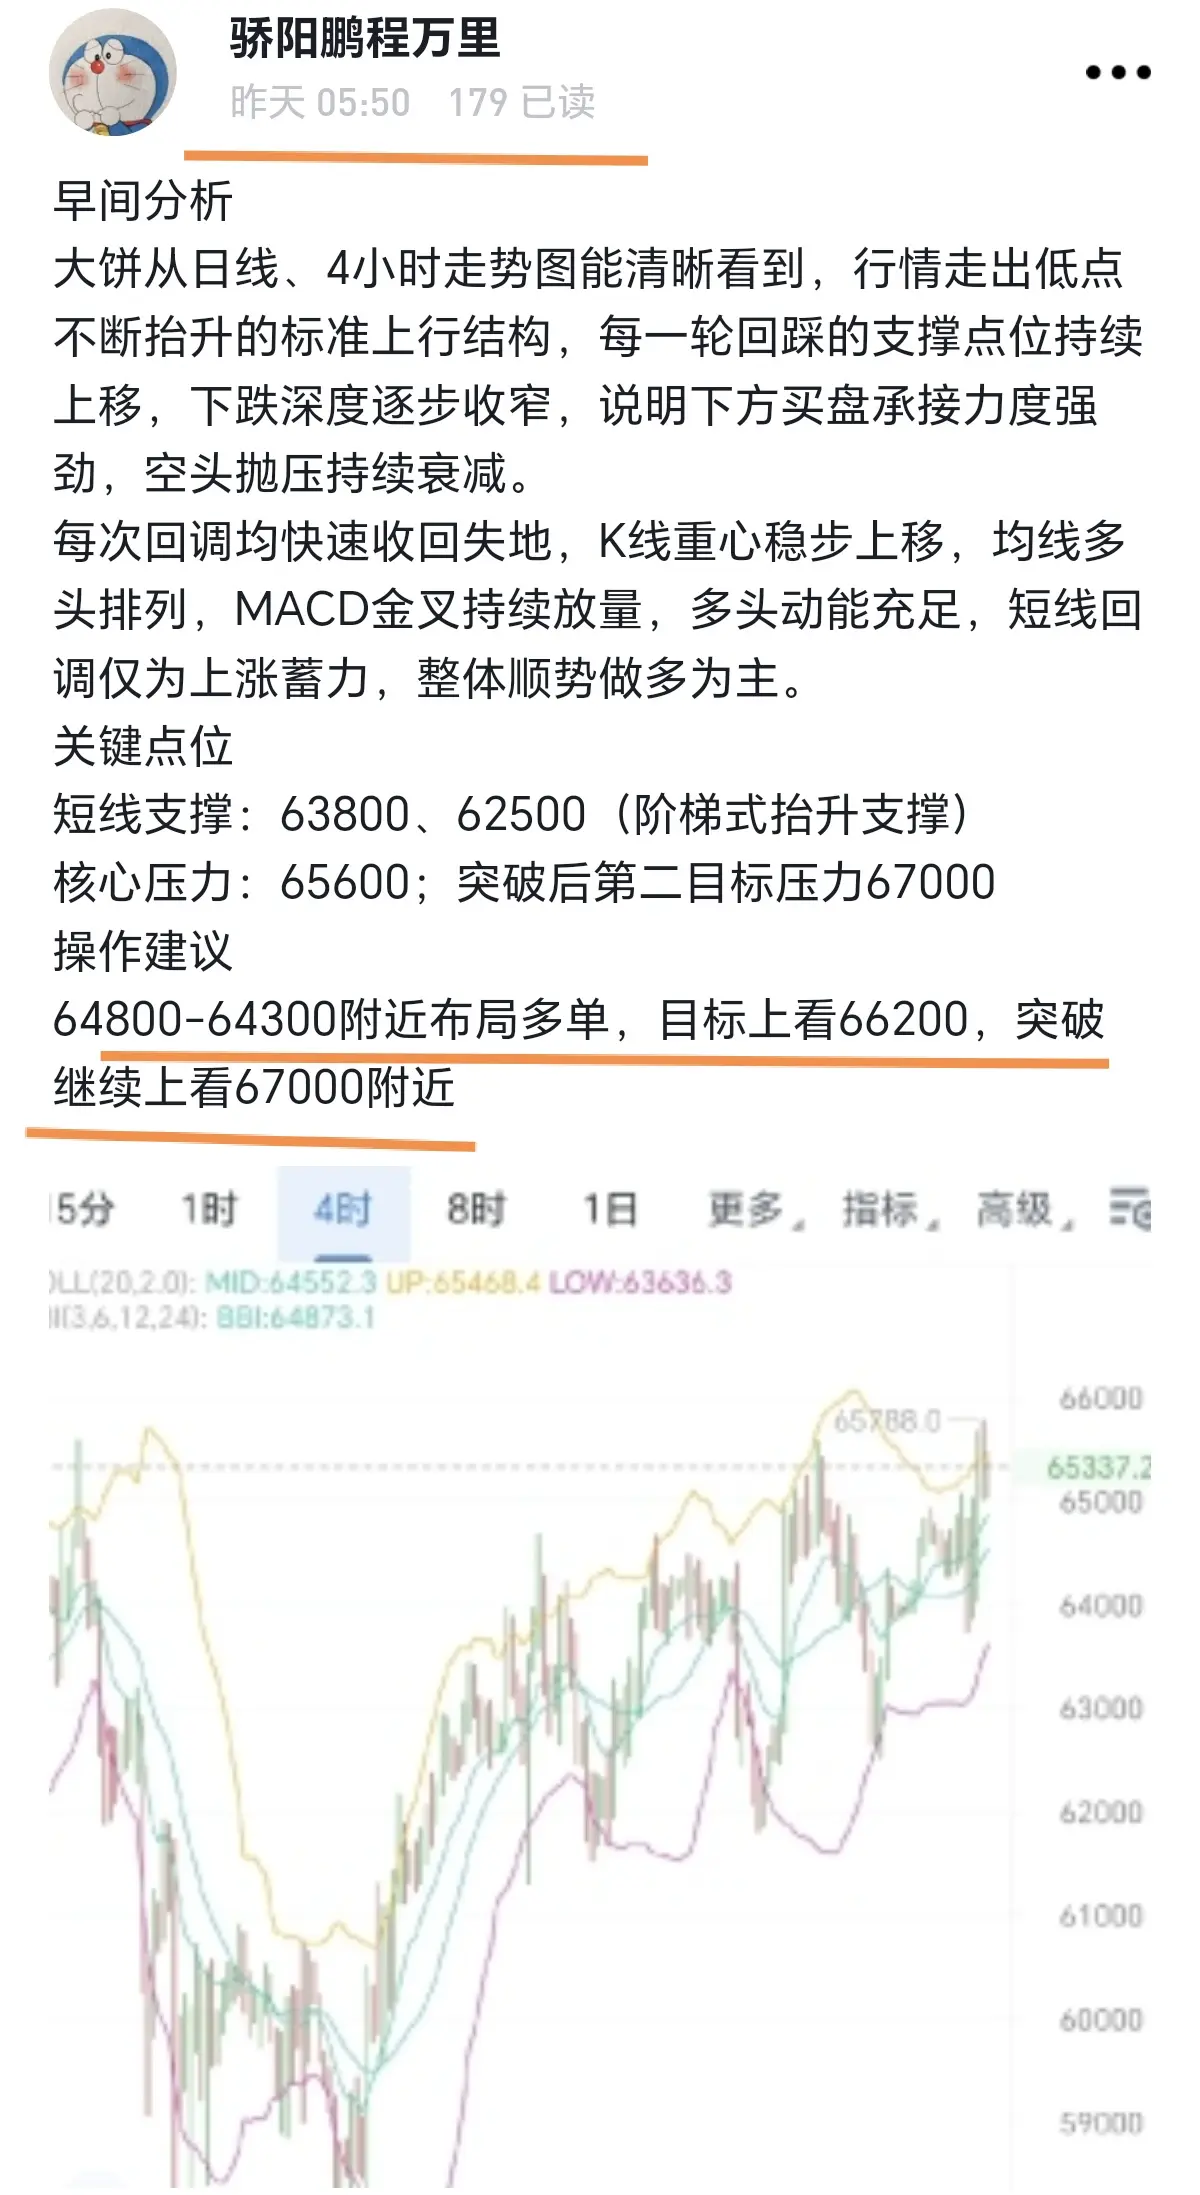
Morning Analysis
From the daily line and the 4-hour chart, BTC clearly shows a standard uptrend structure in which the market keeps lifting its lows. Each round of pullbacks has support levels that continue to rise; the depth of declines gradually narrows, indicating strong buy-side absorption below and that sell pressure from bears keeps weakening.
Each correction is quickly reclaimed, losses are recovered fast, the K-line center of gravity rises steadily, moving averages are in a bullish alignment, the MACD golden cross keeps expanding in volume, bullish momentum is sufficient. Short-term pu
BTC-2.37%
ETH-1.80%
View Original
post-image
  • Reward
  • Comment
  • Repost
  • Share
Down 500 points, but the situation isn’t a big problem, since the pressure level at 65,000 hasn’t been effectively broken yet. I set the stop loss at 66,200 $BTC $ETH #GUSD年化升至3.8%
BTC-2.37%
ETH-1.80%
View Original
post-image
post-image
  • Reward
  • Comment
  • Repost
  • Share
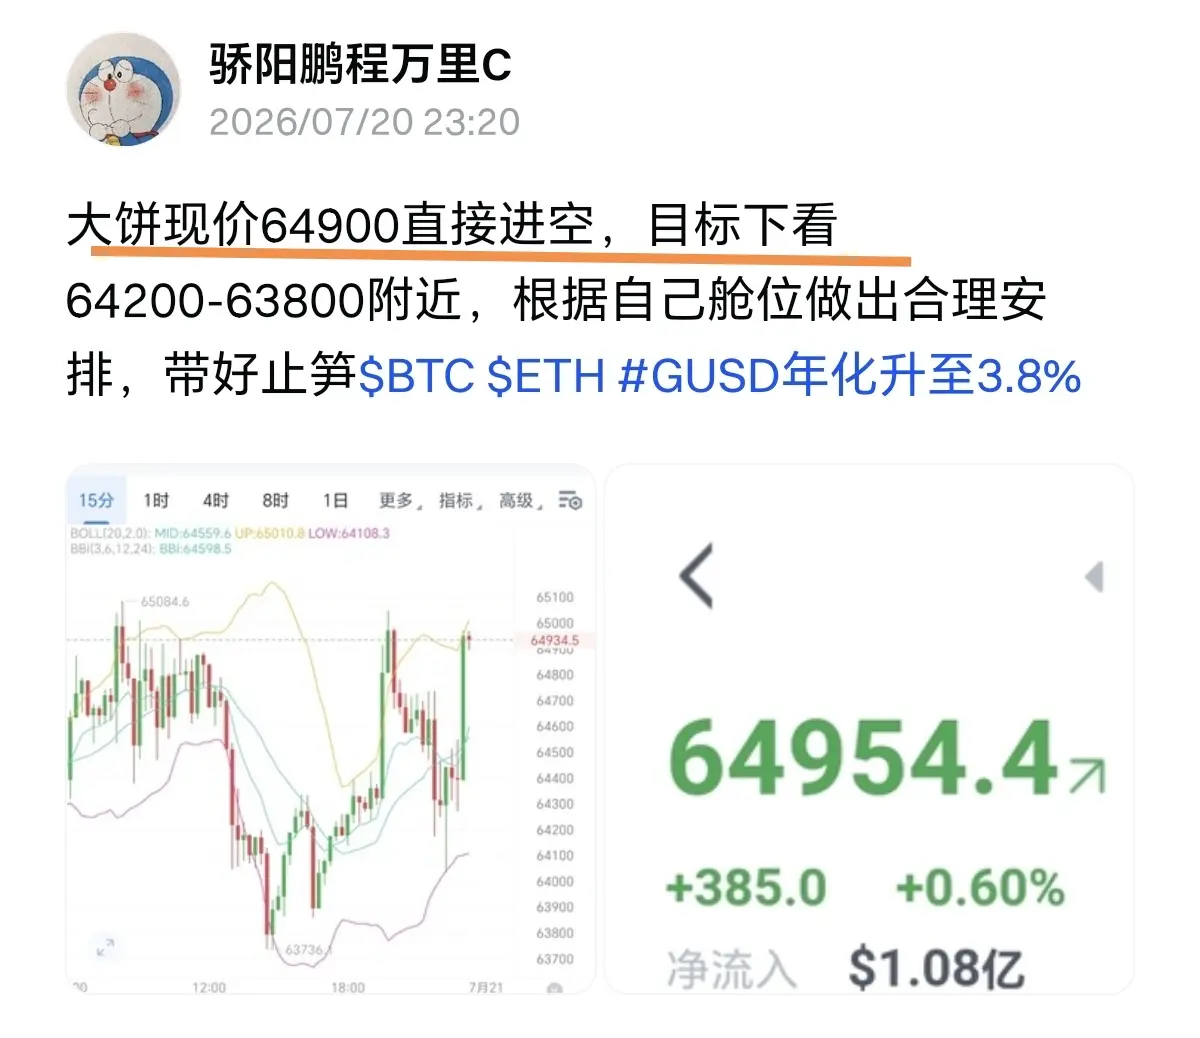
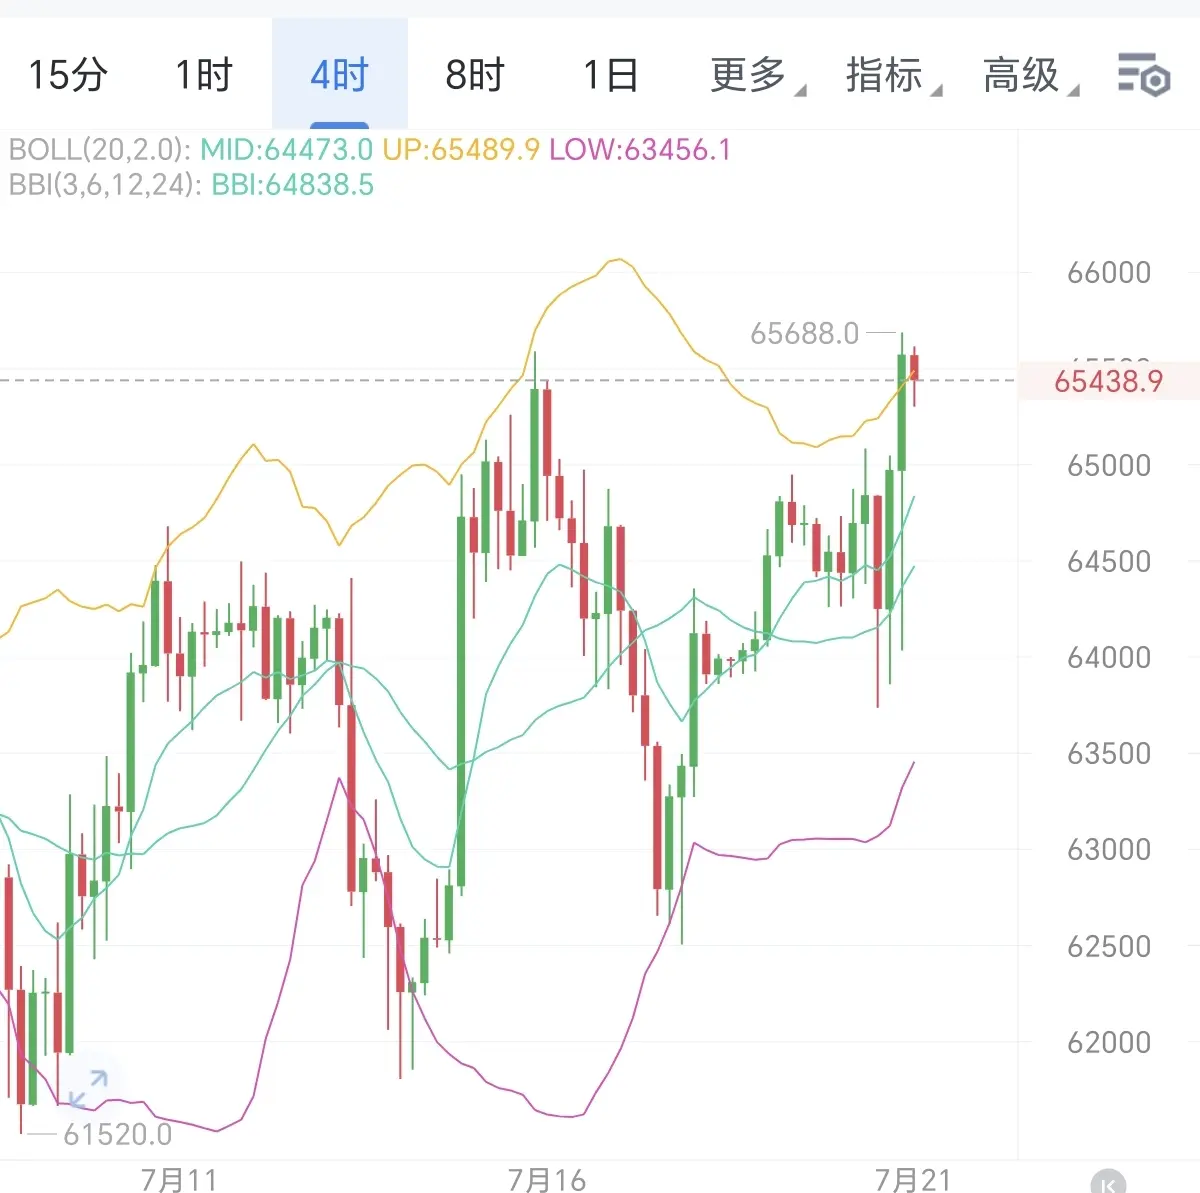
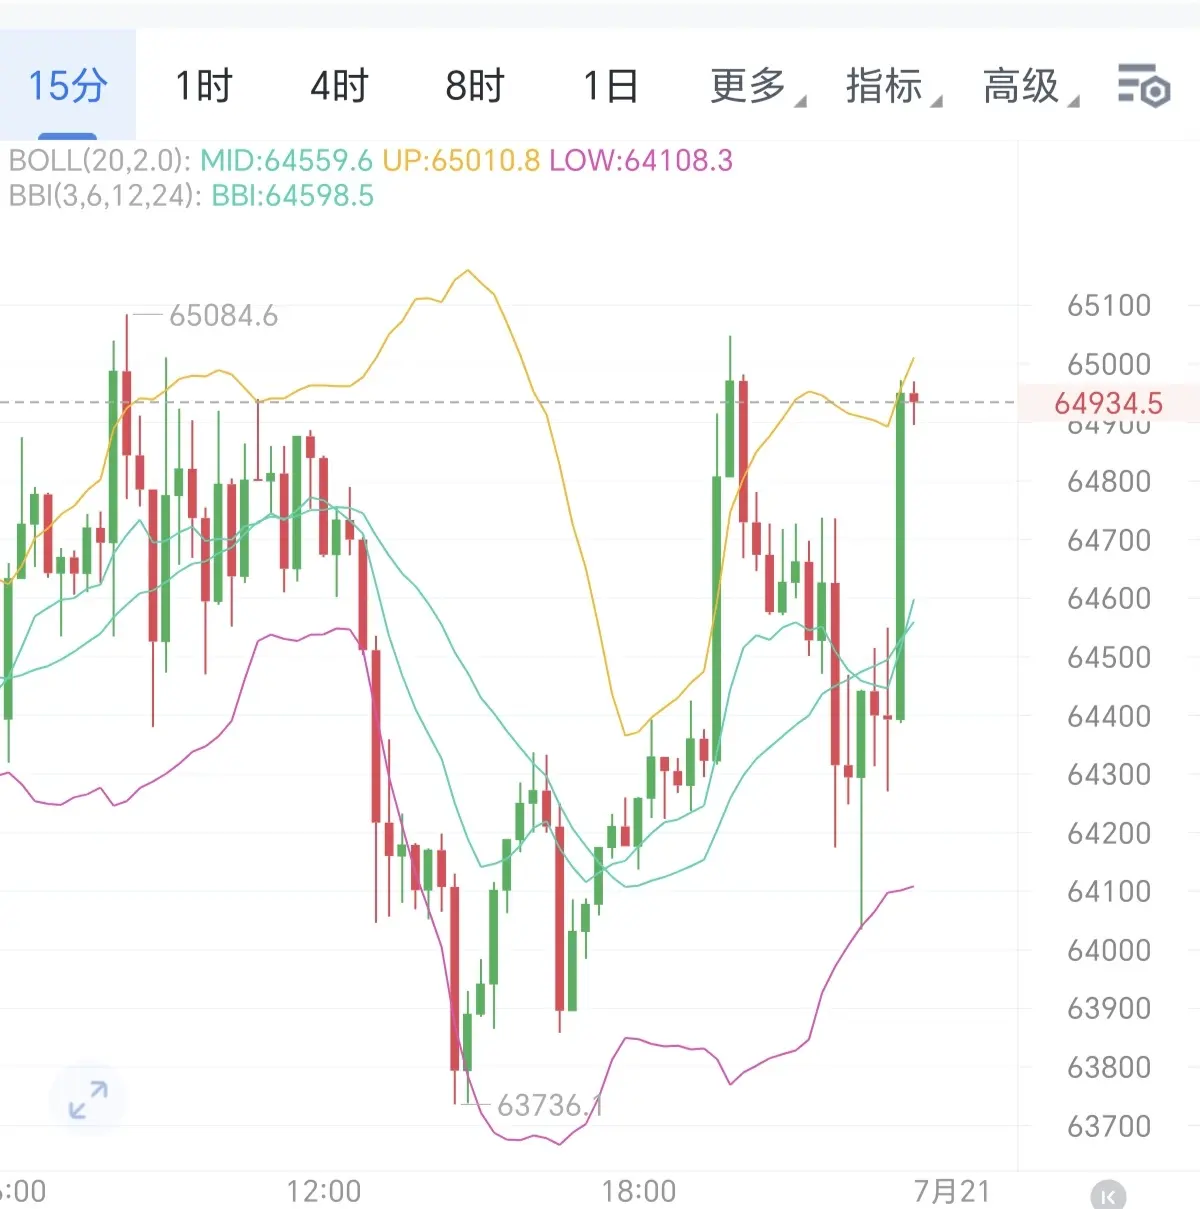
BTC at the current price 64,900, go short directly. The target is to watch down around 64,200–63,800. Make a reasonable plan based on your own position size, and set your stop-loss. $BTC $ETH #GUSD年化升至3.8%
BTC-2.37%
ETH-1.80%
View Original
post-image
post-image
  • Reward
  • Comment
  • Repost
  • Share
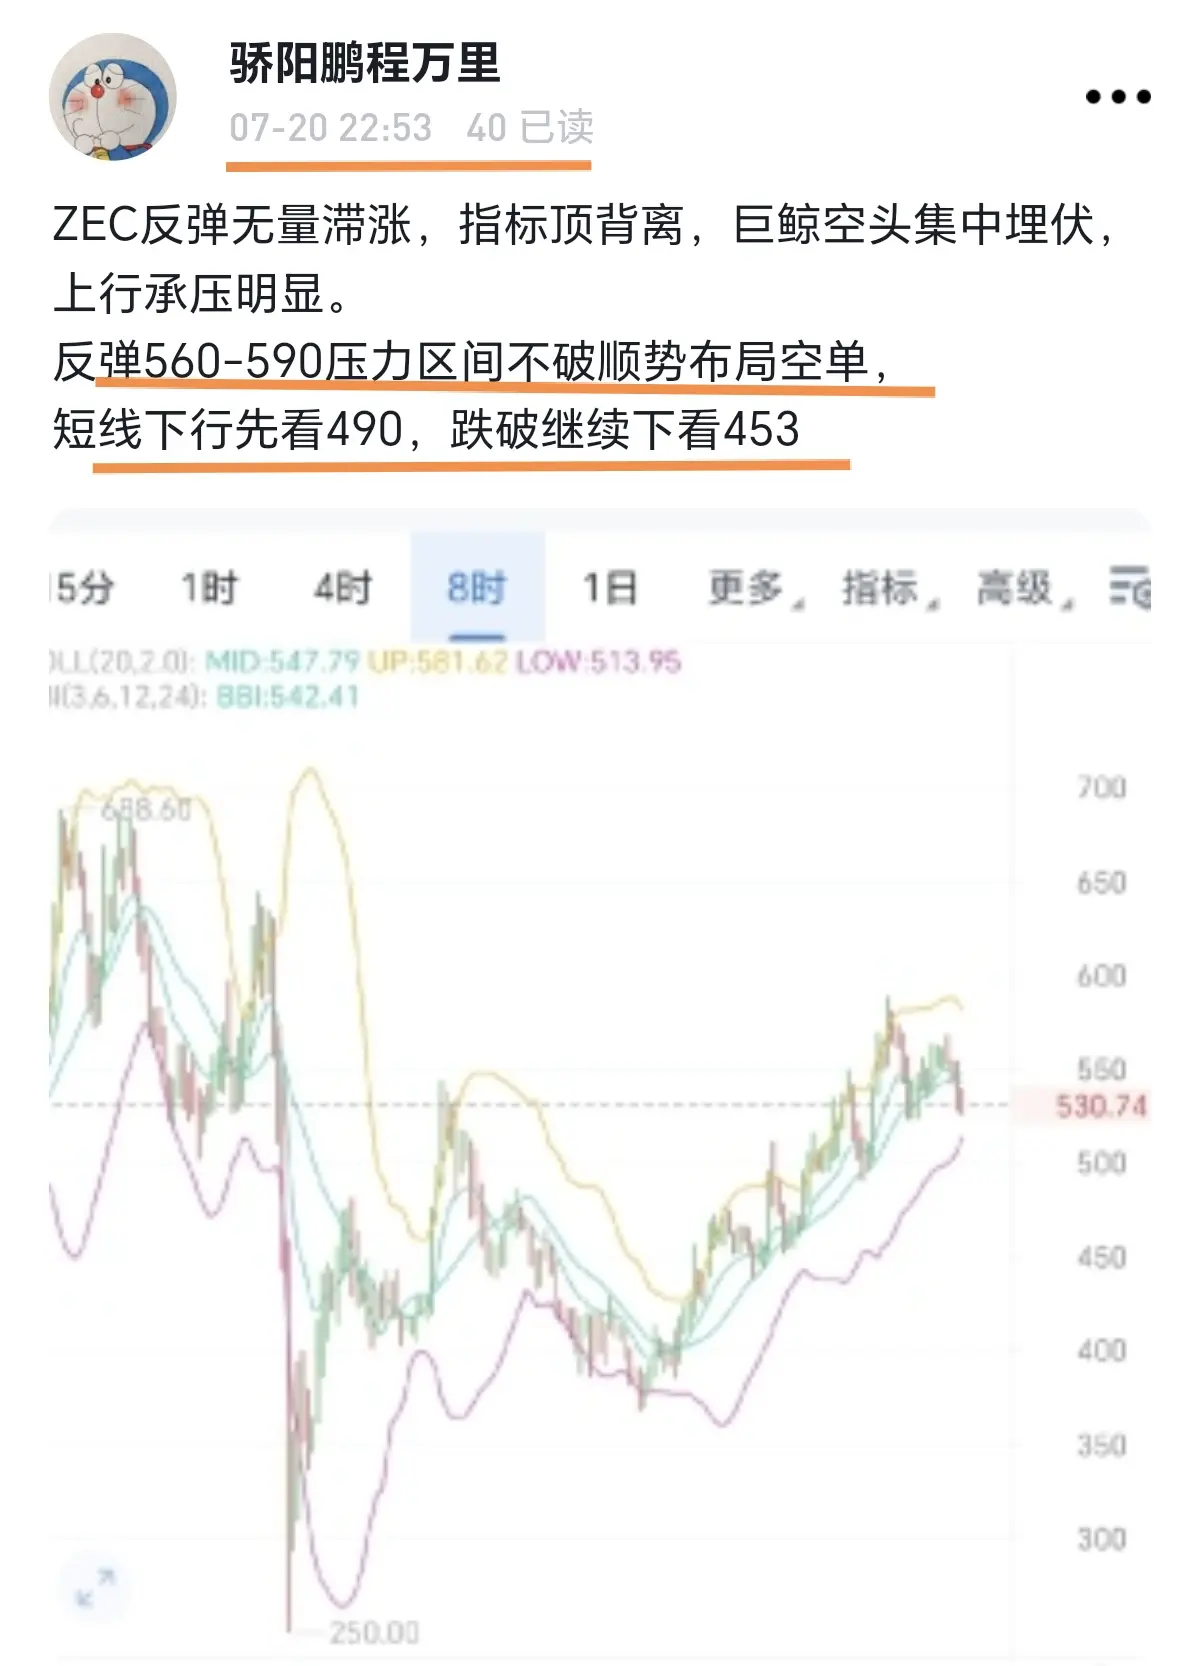
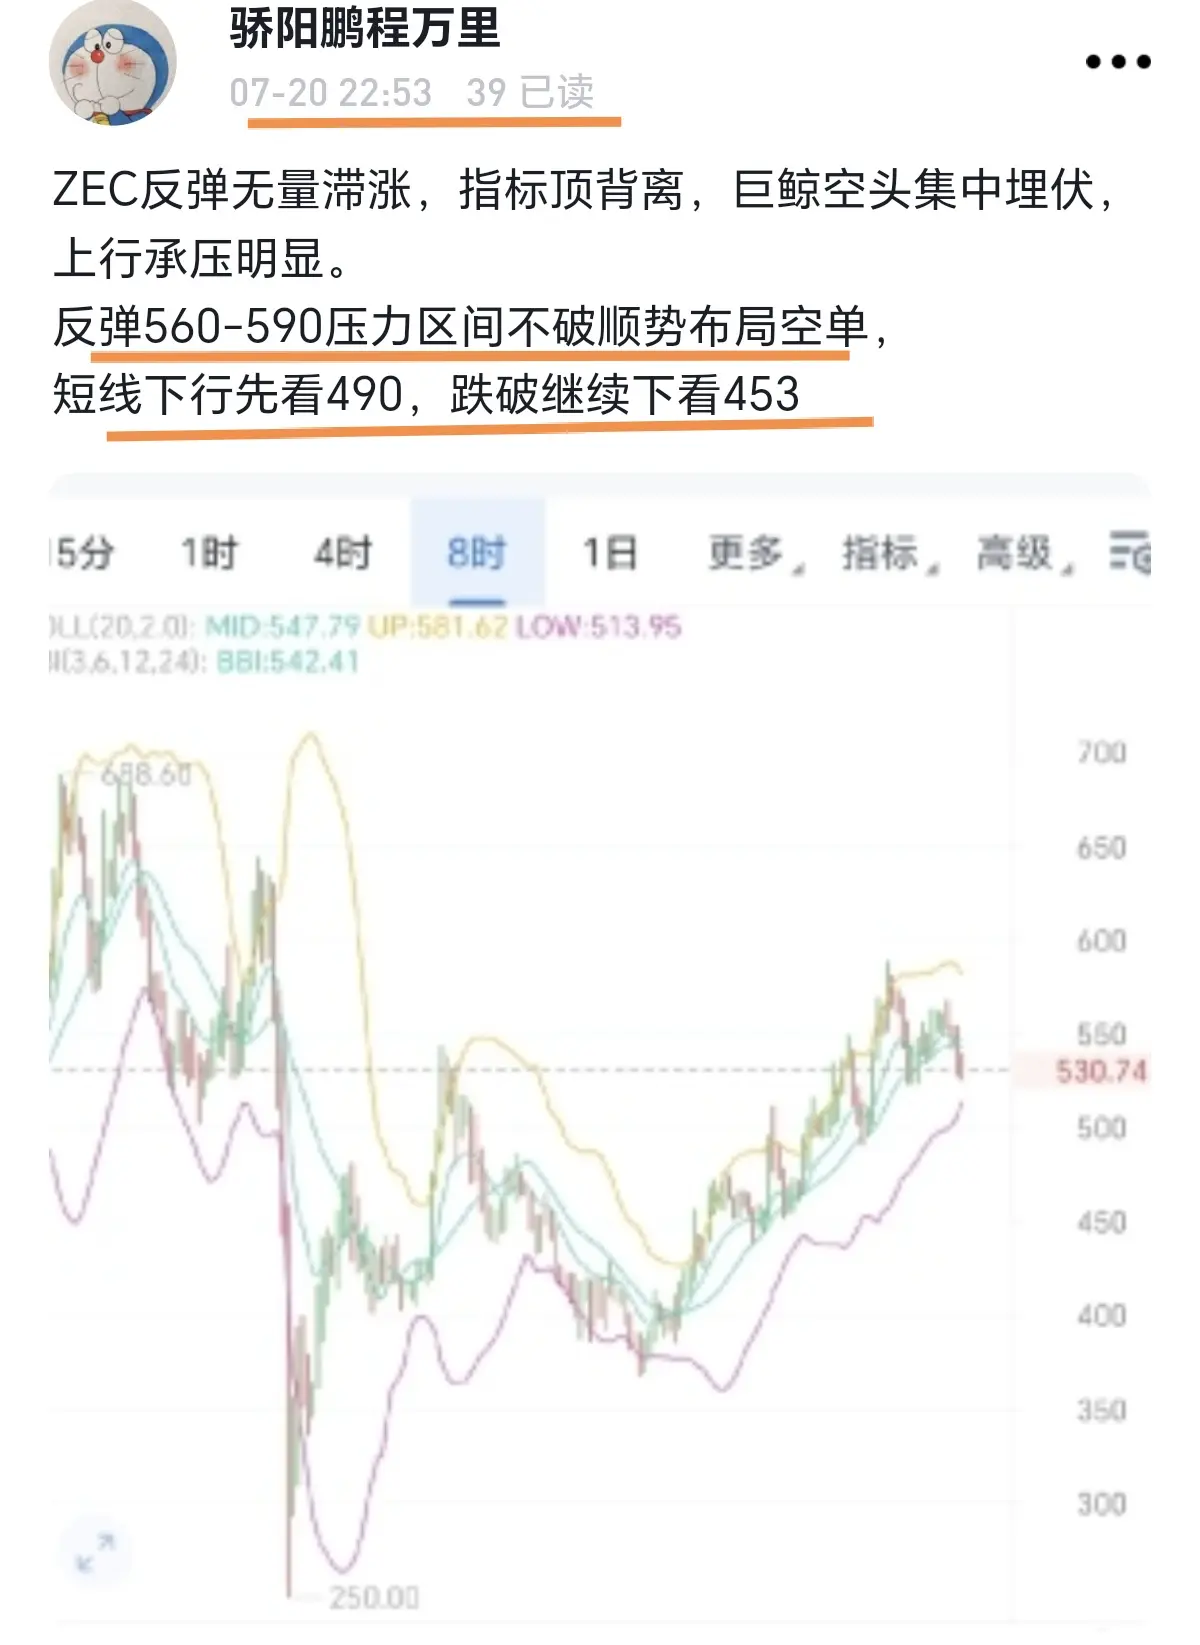
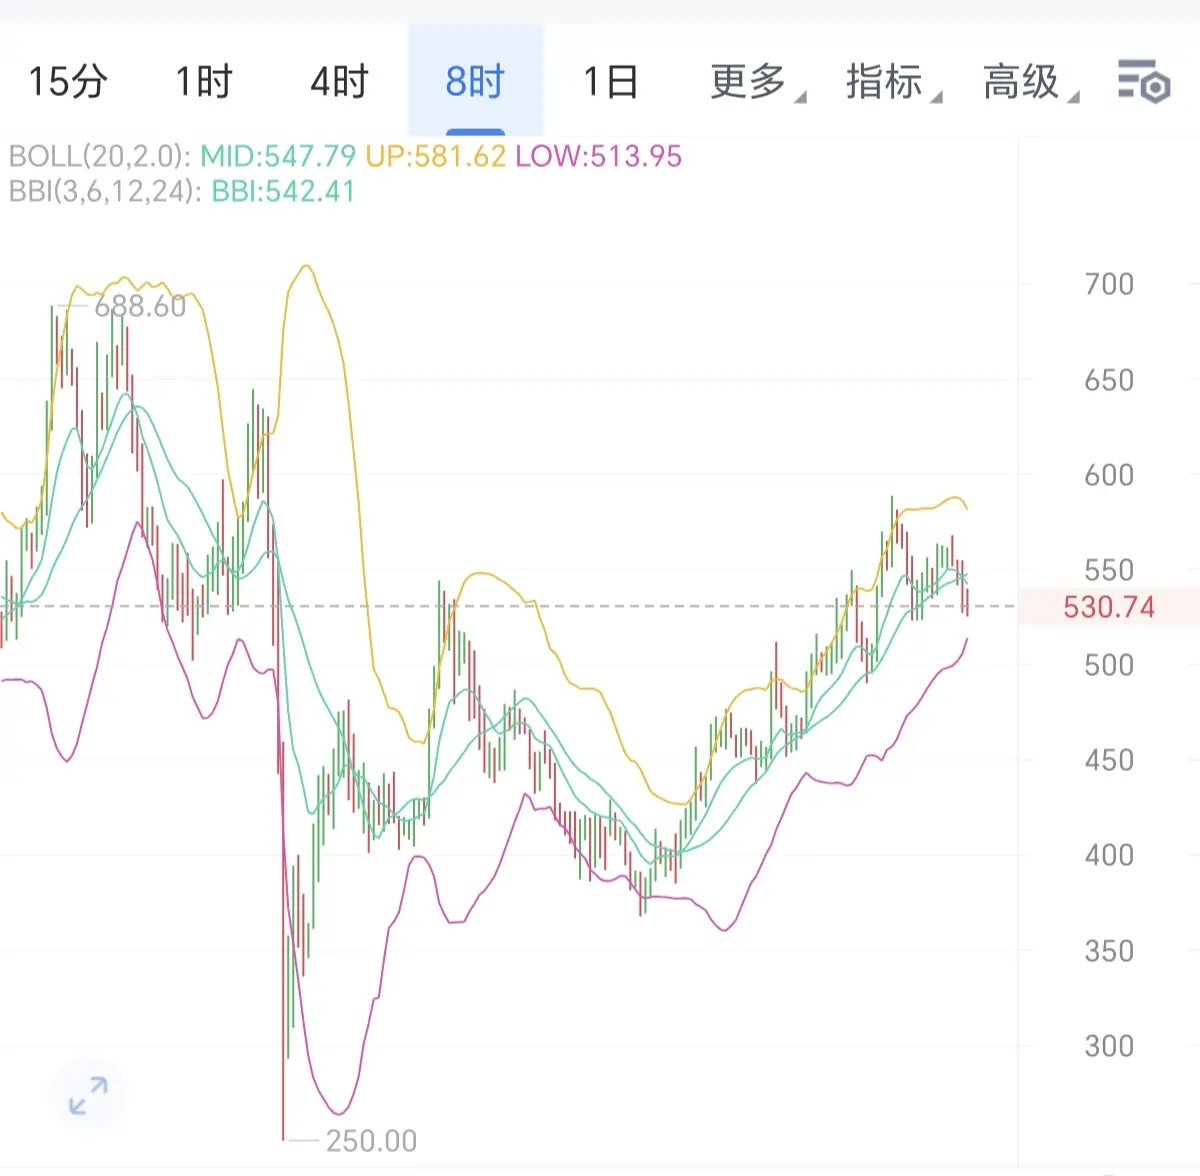
ZEC rebounds without volume, with stalled upside; indicators show bearish divergence at the top. Large whale shorts are concentratedly positioned, and upward pressure is clearly evident.
If the rebound 560-590 resistance zone is not broken, follow the trend and set up a short position.
For the short term, first look for a drop to 490; if it breaks down further, continue to target 453$BTC $ZEC #GUSD年化升至3.8%
BTC-2.37%
ZEC-5.94%
View Original
post-image
  • Reward
  • Comment
  • Repost
  • Share
  • Pinned