ALEXKHAN

vip
Active for: 1.8y
Peak Tier 0
No content yet
#SummerCreationCamp
#BTC
Bitcoin Market Analysis at $64,036 — The Most Important Decision Point of 2026 Could Decide Bitcoin's Next Multi-Month Trend
Bitcoin is currently trading around $64,036, a price level that has become one of the most closely watched areas in the entire cryptocurrency market. After losing nearly 49% from its October 2025 all-time high of approximately $126,000, Bitcoin has entered a period where almost every major market force is competing for control. Unlike previous corrections that were driven mainly by crypto-specific events, today's market is being influenced by g
BTC0.37%
HighAmbition
#SummerCreationCamp
#BTC
Bitcoin Market Analysis at $64,036 — The Most Important Decision Point of 2026 Could Decide Bitcoin's Next Multi-Month Trend
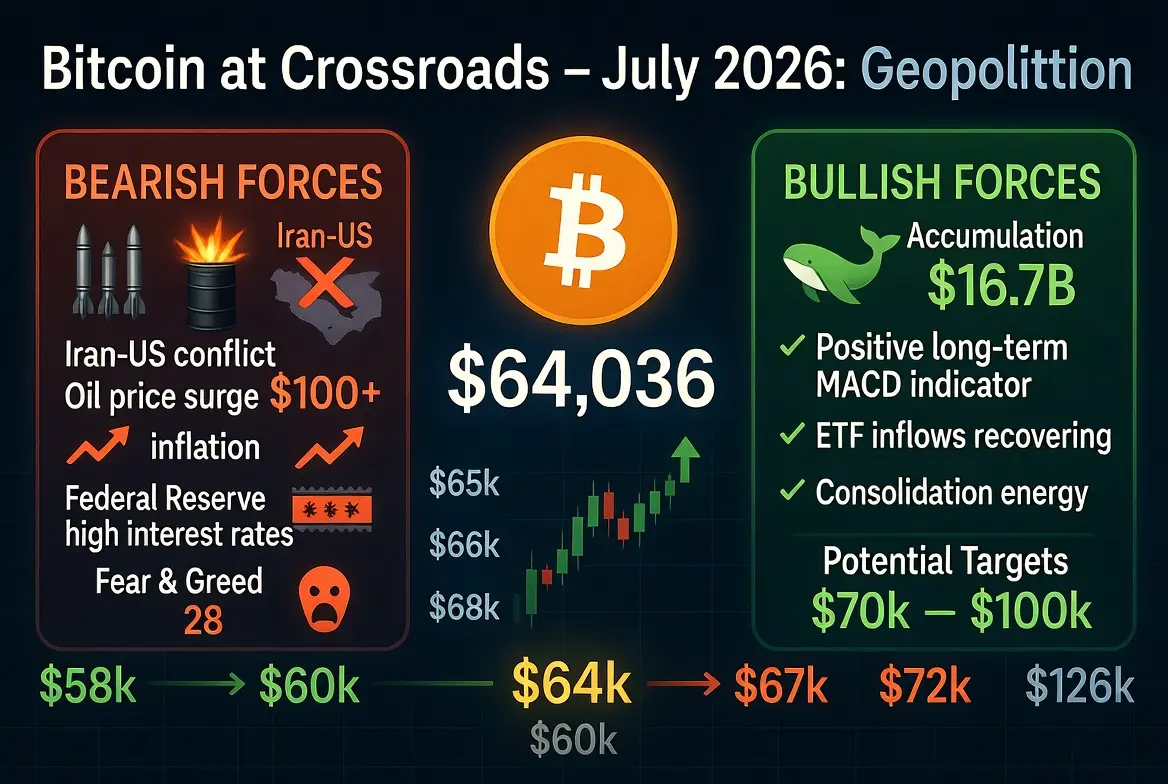
Bitcoin is currently trading around $64,036, a price level that has become one of the most closely watched areas in the entire cryptocurrency market. After losing nearly 49% from its October 2025 all-time high of approximately $126,000, Bitcoin has entered a period where almost every major market force is competing for control. Unlike previous corrections that were driven mainly by crypto-specific events, today's market is being influenced by global geopolitics, rising energy prices, inflation expectations, Federal Reserve policy, institutional capital flows, whale accumulation, derivatives positioning, and investor psychology all at the same time. The Fear & Greed Index remains at 28, firmly inside the Fear zone, showing that retail investors remain cautious despite Bitcoin recovering significantly from its June lows. Historically, markets often create their biggest opportunities when uncertainty reaches extreme levels, but they can also experience one final wave of selling before a sustainable recovery begins.
That is exactly why the current market deserves careful analysis rather than emotional decision-making. Every major indicator currently tells a different story, making this one of the most fascinating periods Bitcoin has experienced during the current cycle.
Iran-US Conflict Has Become the Largest Driver of Global Markets
The biggest factor currently influencing Bitcoin is no longer crypto itself but the escalating geopolitical confrontation between Iran and the United States. Military operations, retaliatory strikes, and growing instability across the Middle East have dramatically increased uncertainty in financial markets. Investors are closely monitoring every development because the conflict directly threatens global energy supplies through the Strait of Hormuz, a strategic shipping route responsible for transporting roughly one-fifth of the world's oil exports. Every indication that supply could be disrupted has pushed crude oil prices sharply higher, increasing concerns that inflation could remain elevated much longer than previously expected. Rising oil prices increase transportation costs, manufacturing expenses, and consumer prices across almost every sector of the global economy. If inflation accelerates again, central banks may delay interest-rate cuts or even maintain restrictive monetary policy for longer than expected. Higher interest rates reduce liquidity across financial markets, making speculative assets such as Bitcoin less attractive in the short term. Recent price action has confirmed this relationship clearly. Whenever geopolitical tensions intensified, Bitcoin experienced immediate selling pressure, while every sign of diplomacy or possible de-escalation produced rapid recoveries. At the present moment, Bitcoin is behaving more like a global risk asset than a traditional safe haven, meaning macroeconomic headlines are likely to remain the primary catalyst for price movements over the coming weeks.
Technical Structure Shows Bitcoin Is Preparing for a Major Move
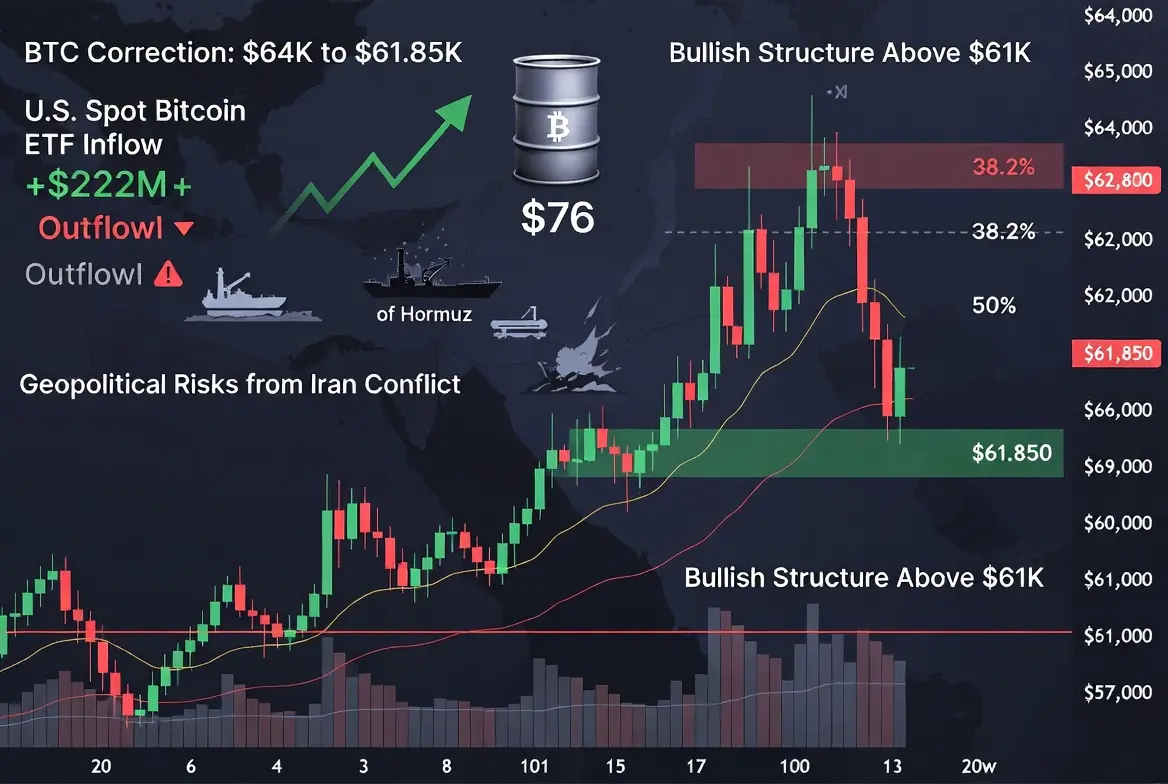
From a technical perspective, Bitcoin is trading inside one of the most important consolidation ranges of the year. Following the sharp rebound from the June low near $58,300, buyers successfully regained control and pushed prices back above $64,000. However, the market has repeatedly struggled to establish sustained momentum above the $65,000-$68,000 resistance zone, where heavy selling pressure continues to emerge. This repeated rejection suggests that large market participants are still taking profits whenever Bitcoin approaches higher resistance levels. At the same time, bears have also failed to force a decisive breakdown below $60,000-$61,000, demonstrating that buyers remain willing to accumulate during periods of weakness. This battle between buyers and sellers has created a tightening price range that often precedes a significant breakout. Long-term indicators remain relatively constructive, with the MACD maintaining a positive crossover and broader demand indicators gradually improving after the weakness observed during June. Nevertheless, the daily RSI indicates that short-term momentum has become stretched, increasing the possibility of temporary pullbacks before another attempt to challenge higher resistance.
Traders should understand that consolidation periods like the current one rarely last forever.
Eventually, one side gains control, and the resulting breakout often produces large price movements that define market direction for several months.
Whale Accumulation Continues to Send an Extremely Bullish Long-Term Signal
Perhaps the most encouraging development during recent weeks has been the aggressive behavior of large Bitcoin holders. Blockchain data indicates that whales accumulated more than 270,000 BTC, representing approximately $16.7 billion in purchases within a relatively short period. Such large-scale accumulation rarely occurs randomly. Historically, whales have consistently increased exposure during periods when retail investors were fearful and market sentiment was deeply pessimistic. At the same time, exchange reserves have continued declining, suggesting that many investors are transferring Bitcoin into long-term storage instead of preparing to sell. Long-term holders also remain remarkably inactive despite ongoing volatility, another indication that experienced investors continue believing in Bitcoin's long-term value proposition. Although institutional ETF flows experienced weakness during June, more recent inflows suggest that traditional financial demand is gradually recovering. This divergence between cautious retail sentiment and confident whale accumulation creates one of the strongest long-term bullish arguments currently available. While short-term volatility may continue, history repeatedly demonstrates that sustained accumulation by large investors often lays the foundation for the next significant upward trend once macroeconomic conditions begin improving.
Market Outlook and Trading Strategy
Looking ahead, Bitcoin's next major move will likely depend on developments outside the cryptocurrency industry itself. If geopolitical tensions ease, oil prices stabilize, inflation expectations decline, and institutional inflows continue improving, Bitcoin could successfully break above $68,000 before targeting the $72,000-$75,000 region. A successful recovery above those levels would significantly strengthen the probability of revisiting $87,000 later this year, with $100,000 becoming a realistic longer-term objective if macroeconomic conditions remain supportive.
On the other hand, renewed military escalation, another sharp increase in oil prices, unexpectedly strong inflation data, or aggressive Federal Reserve rhetoric could quickly reverse current optimism and push Bitcoin back toward the critical $60,000-$61,000 support zone. A decisive breakdown below that region would expose $58,300, followed by $53,000, while an extreme macroeconomic shock could temporarily drive prices toward $46,000 before long-term buyers return. For traders, patience remains the most valuable strategy. Rather than chasing every short-term price movement, investors should focus on disciplined position sizing, strict risk management, and confirmation from both technical indicators and macroeconomic developments. Bitcoin has repeatedly rewarded patient investors throughout its history, but successful investing has always required preparation rather than prediction. The coming 7 to 14 days could become one of the most decisive periods of 2026, making careful observation far more important than emotional trading decisions.
@Gate_Square
repost-content-media
  • Reward
  • 2
  • Repost
  • Share
Lock_433:
Buy To Earn 💰️
View More
#EventContractsLaunch
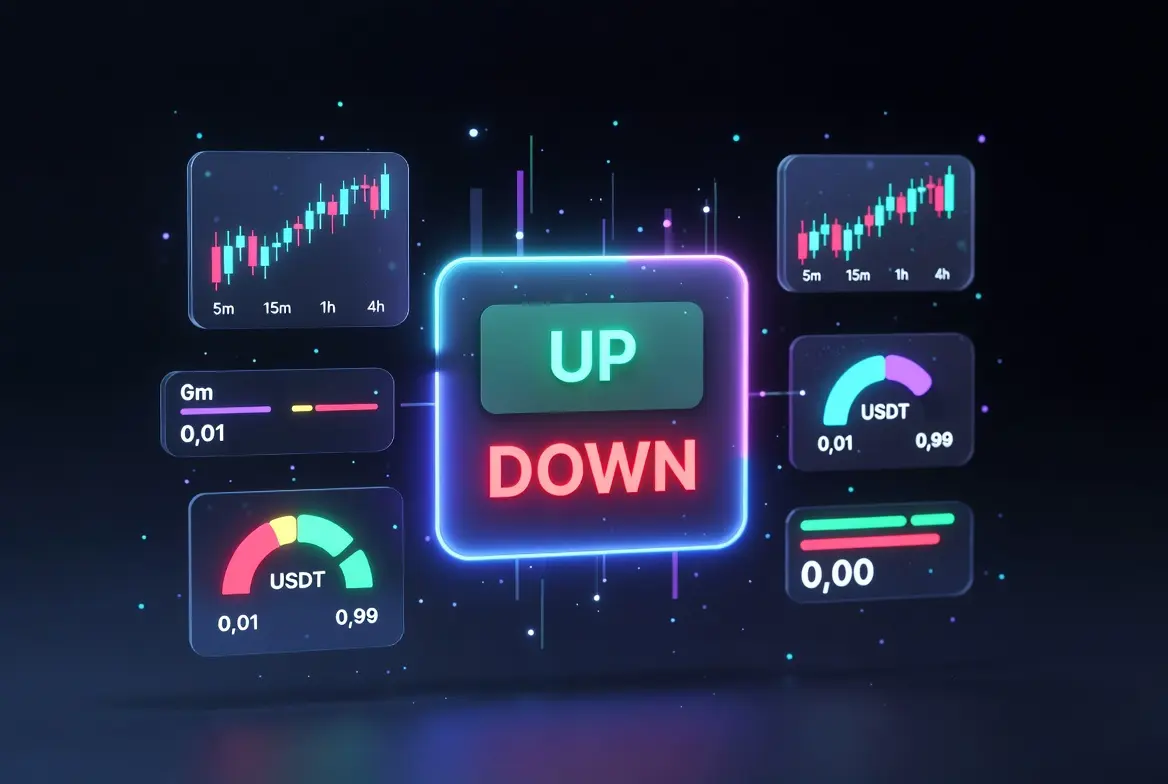
Gate has officially launched Event Contracts, a groundbreaking trading product that transforms how everyday users participate in the crypto market. This is not just another derivative instrument with complicated leverage settings and margin calculations. Event Contracts strip away all the complexity and distill trading into its most fundamental form: predicting whether the price of an asset will go up or down within a specific timeframe. Whether you believe Bitcoin will rise in the next 15 minutes or Ethereum will fall over the next hour, you simply choose your direction
HighAmbition
#EventContractsLaunch
Gate has officially launched Event Contracts, a groundbreaking trading product that transforms how everyday users participate in the crypto market. This is not just another derivative instrument with complicated leverage settings and margin calculations. Event Contracts strip away all the complexity and distill trading into its most fundamental form: predicting whether the price of an asset will go up or down within a specific timeframe. Whether you believe Bitcoin will rise in the next 15 minutes or Ethereum will fall over the next hour, you simply choose your direction, pick your price on the order book, submit your order, and you are in. That is the entire process. No leverage to manage, no margin calls to fear, no forced liquidation threatening your position. The product is designed to make short-term market participation intuitive, accessible, and genuinely enjoyable for everyone from first-time traders to seasoned professionals.
The concept behind Event Contracts is elegantly simple yet deeply powerful. Each contract represents a binary outcome prediction on the price direction of a specific digital asset. Currently, the inaugural release supports Bitcoin and Ethereum, the two most prominent assets in the entire crypto ecosystem. Users can trade across multiple settlement intervals including 5-minute, 15-minute, 1-hour, and 4-hour contracts. This range of timeframes accommodates different trading styles and market outlooks. A fast-moving trader who monitors minute-by-minute charts might prefer the 5-minute cycle, while a more strategic participant who studies broader market trends might find the 4-hour window more suitable. Regardless of the timeframe chosen, the core mechanic remains identical: you predict Up or Down, you buy the corresponding contract shares, and the market settles the outcome based on actual price data when the cycle concludes.
One of the most revolutionary aspects of Event Contracts is the probability-based pricing model. Each contract is valued between 0.01 and 0.99 USDT, and that price is not arbitrary. It directly reflects the market collective assessment of how likely a particular outcome is. If the Bullish contract for a BTC 15-minute event is priced at 0.65 USDT, it means the aggregated wisdom of all market participants currently estimates a 65 percent probability that BTC will finish higher at the end of that window. This is not guesswork. This is real capital being deployed by real traders who have skin in the game, and their collective positioning generates a live, continuously updating probability signal. When new information enters the market, whether it is a macroeconomic headline, an on-chain whale movement, or a sudden shift in sentiment, traders immediately adjust their positions, and the contract price moves to reflect the updated probability. This mechanism transforms every contract into a living, breathing information aggregator.
The settlement mechanics are transparent and straightforward. If your prediction is correct, each winning contract settles at exactly 1 USDT, and Gate charges zero settlement fees on winning positions. Consider a practical scenario: you buy 100 shares of a BTC Bullish contract at 0.40 USDT per share, investing a total of 40 USDT. The event period concludes, and BTC indeed closes higher than its starting price. Your 100 contracts each settle at 1 USDT, delivering 100 USDT to your account. Your net profit is 60 USDT, a 150 percent return on your initial investment, all without any leverage involved. Conversely, if the price moves against your prediction, the contracts expire worthless and your loss is limited to the 40 USDT you originally spent. There is no possibility of losing more than you put in. This capped-risk structure is fundamentally different from traditional futures trading where leveraged positions can generate losses far exceeding the initial margin.
The ability to exit positions before expiration adds another critical layer of flexibility. Event Contracts are not a lock-in_until-settlement product. At any point before the event period concludes, you can sell your contract shares on the order book to lock in profits or cut losses. If you bought BTC Bullish shares at 0.40 USDT and the contract price climbs to 0.72 USDT as market sentiment shifts in your favor, you can immediately sell all 100 shares and capture approximately 32 USDT in profit without waiting for the event to end. Similarly, if the market begins moving against your position, you can sell early to minimize your loss rather than holding until zero expiration. This early exit capability mirrors the flexibility of traditional exchange trading while preserving the simplicity of the binary outcome structure.
Gate has also designed the entry threshold to be remarkably low. The minimum trade size is just 1.5 USDT with a minimum order quantity of 6 contract shares. This means you can begin exploring the product, testing your market intuition, and developing your trading approach with virtually negligible capital commitment. The low barrier is intentional. Gate wants as many users as possible to discover and benefit from this product, and the design ensures that participation is open to anyone with even the smallest amount of USDT in their account.
To celebrate the launch, Gate is running a Debut Carnival with a total prize pool of $50,000 distributed across three distinct reward mechanisms. The first is First Trade Loss Compensation, where the first 2000 users who experience a loss on their initial trade will receive a reimbursement of their actual loss amount, up to $5 per person. This effectively gives new traders a safety net on their very first experience with Event Contracts, removing the fear of an immediate loss on an unfamiliar product. The second reward is Profit Double, where net profits from Event Contract trading are doubled for reward purposes, with a maximum of $500 per person and a total pool of $20,000 distributed from highest profit downward until the pool is exhausted. The third is Trading Volume Sprint, where users whose cumulative trading volume reaches at least $1,000 share a $20,000 pool proportionally based on their total volume, with a maximum of $1,000 per person. The carnival runs from July 21 to July 31, and users must register by clicking the participation button on the campaign page before trading to qualify for rewards.
The product also supports both Market Orders and Limit Orders, giving traders full control over execution. Market Orders provide instant fills for urgent entries or exits, while Limit Orders let you specify your desired price for precise cost management. This dual order system ensures that whether you are acting on a sudden market impulse or carefully planning your entry at a specific probability level, the platform accommodates your approach.
Looking ahead, Gate has signaled that Event Contracts will expand beyond the initial BTC and ETH offerings. More assets, more event categories including Price Above, Price Below, and Range-based contracts, and additional contract durations are all on the roadmap. The current Up-Down binary format is the foundation, but the architecture supports much richer event structures that will enable traders to express increasingly nuanced market views. This expansion will transform Event Contracts from a simple direction-prediction tool into a comprehensive event-trading ecosystem where virtually any definable market outcome can become a tradable instrument.
In essence, Gate Event Contracts represent a paradigm shift in how retail users interact with crypto markets. By replacing the intimidating complexity of leverage, margin, and liquidation mechanics with a clean probability-based prediction model, Gate has created a product that is simultaneously accessible to newcomers and sophisticated enough to attract experienced traders. The capped risk, the transparent settlement, the early exit flexibility, the low entry threshold, and the generous debut carnival rewards all converge to make this one of the most compelling new trading products in the digital asset space. The future of trading does not require you to master complicated derivatives terminology. It simply asks you one question: Up or Down? And with Gate Event Contracts, your answer can now be backed by real capital, real probability data, and real market outcomes.
@Gate_Square #SummerCreationCamp
repost-content-media
  • Reward
  • 2
  • Repost
  • Share
Lock_433:
2026 GOGOGO 👊
View More
#BrentReturnsTo100
The return of Brent crude above the historic $100 per barrel threshold marks one of the most significant macroeconomic developments of 2026. Brent has climbed from the low-$80 region to above $100, representing a rally of more than 25% in a relatively short period. This is not a routine commodity price increase driven by seasonal demand. Instead, the move reflects a rapidly expanding geopolitical risk premium as investors reassess the possibility of prolonged supply disruptions across the Middle East. Every missile strike, military deployment, drone attack, sanctions announ
HighAmbition
#BrentReturnsTo100
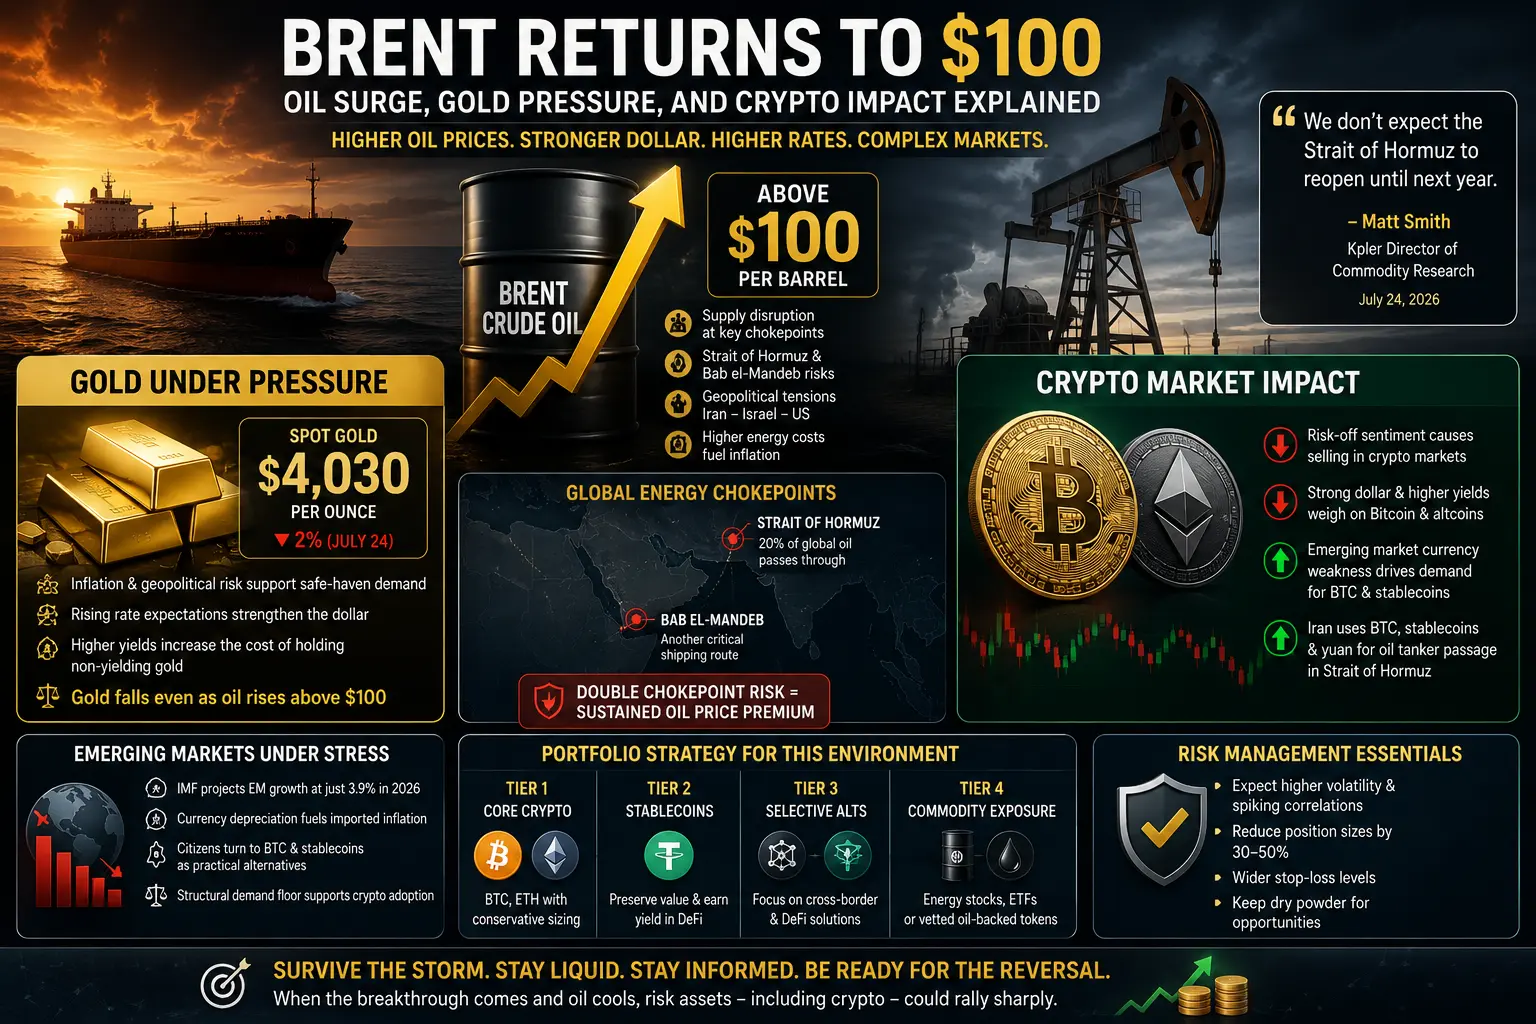
The return of Brent crude above the historic $100 per barrel threshold marks one of the most significant macroeconomic developments of 2026. Brent has climbed from the low-$80 region to above $100, representing a rally of more than 25% in a relatively short period. This is not a routine commodity price increase driven by seasonal demand. Instead, the move reflects a rapidly expanding geopolitical risk premium as investors reassess the possibility of prolonged supply disruptions across the Middle East. Every missile strike, military deployment, drone attack, sanctions announcement, or shipping incident now has the potential to move crude prices by 2%, 3%, 5%, or even more within hours. Oil is no longer trading purely on supply and demand fundamentals; it is trading on uncertainty, fear, and the probability of future disruptions.
The biggest driver behind this rally is the escalating conflict involving Iran. Iran remains one of the world's largest oil producers and occupies one of the most strategically important locations on Earth. The Strait of Hormuz, which lies along Iran's southern coastline, carries approximately 20% of global oil consumption and nearly one-third of the world's seaborne crude exports. Every day, around 20 million barrels of crude oil pass through this narrow waterway. If military operations intensify or commercial shipping becomes increasingly dangerous, even a temporary disruption could remove between 3 million and 10 million barrels per day from global supply. Such a reduction cannot be replaced immediately, forcing traders to rapidly increase oil prices to reflect the growing shortage risk.
The market is currently pricing several possible scenarios. If tensions stabilize without a full military escalation, Brent could remain within the $100-$110 range, representing approximately 10% upside from current levels. If attacks on tankers become more frequent, insurance costs continue rising, and exports decline, Brent could advance toward $115-$125, another 15% to 25% increase. If the Strait of Hormuz experiences prolonged disruption or partial closure, prices between $130 and $150 become increasingly realistic, implying gains of roughly 30% to 50% above current levels. Under an extreme geopolitical scenario involving multiple producing nations, widespread export interruptions, and sustained military conflict, temporary spikes toward $170, $180, or even $200 per barrel cannot be completely dismissed. While such an outcome remains a lower-probability scenario, energy markets have repeatedly demonstrated throughout history that geopolitical crises can push prices far beyond traditional valuation models.
History provides numerous examples supporting this possibility. During the 1973 Arab oil embargo, crude prices surged by more than 300% within months. The 1979 Iranian Revolution triggered another major oil shock as production collapsed. During the 1990 Gulf War, oil prices jumped more than 100% in only a few months before retreating after military operations stabilized. More recently, geopolitical tensions surrounding Russia and Ukraine demonstrated how sanctions, export restrictions, and supply uncertainty can rapidly reshape global commodity markets. Today's environment combines several of these historical risks simultaneously, making comparisons increasingly relevant for investors across every asset class.
Higher oil prices immediately ripple through the global economy. Every $10 increase in Brent raises transportation expenses, airline fuel costs, shipping charges, manufacturing input prices, agricultural production costs, fertilizer expenses, electricity generation costs, and retail prices for countless consumer products. Oil-importing countries experience widening trade deficits, while businesses eventually pass rising costs to consumers. As inflation accelerates, household purchasing power declines, consumer confidence weakens, and corporate profit margins face increasing pressure. These inflationary effects extend well beyond energy markets, influencing nearly every sector of the global economy.
Central banks closely monitor these developments because persistent energy inflation complicates monetary policy decisions. If Brent remains above $100 for an extended period, inflation may stay significantly above official targets. That would increase the probability that the Federal Reserve, the European Central Bank, and other major institutions postpone planned interest-rate cuts. Financial markets could begin pricing fewer rate reductions or even discussing additional tightening should inflation accelerate unexpectedly. Higher interest rates generally strengthen the U.S. dollar, increase Treasury yields, tighten financial conditions, and reduce liquidity available for speculative assets, creating a challenging environment for cryptocurrencies and growth-oriented investments.
This explains why Bitcoin does not always benefit immediately from inflation. Many investors assume inflation automatically supports digital assets because Bitcoin has often been described as digital gold. In reality, the relationship is more complex. If inflation results in tighter monetary policy, a stronger dollar, and rising bond yields, institutional investors frequently reduce exposure to both Bitcoin and gold simultaneously. During previous macroeconomic stress periods, Bitcoin has experienced corrections of 10% to 20% within days, while Ethereum and higher-beta altcoins have occasionally declined 20% to 40% before recovering. Liquidity conditions often matter more than inflation itself during the initial phase of a geopolitical crisis.
Gold faces a similar balancing act. Safe-haven demand increases as geopolitical uncertainty rises, supporting higher prices. However, rising real interest rates and a stronger dollar increase the opportunity cost of holding non-yielding assets such as gold. This explains why gold can occasionally decline even while oil prices surge and geopolitical risks intensify. The same competing forces influence Bitcoin, Ethereum, and the broader digital asset market, highlighting the importance of monitoring both inflation expectations and central-bank policy rather than focusing exclusively on commodity prices.
Emerging markets may become one of crypto's strongest long-term demand drivers during this period. Countries facing currency depreciation, imported inflation, and declining purchasing power often experience rising adoption of Bitcoin and U.S. dollar-backed stablecoins.
Citizens seek alternatives that preserve value more effectively than weakening local currencies. Similar adoption trends have historically appeared across Turkey, Argentina, Nigeria, South Asia, Latin America, and parts of Africa. As inflation accelerates and domestic currencies weaken, demand for digital assets as alternative stores of value can continue expanding despite institutional selling pressure in developed markets.
If geopolitical tensions remain unresolved through late 2026 and into 2027, Brent may continue trading with a significant geopolitical premium. Rather than fluctuating around traditional equilibrium levels, prices could remain elevated above $100 for several quarters.
Sustained prices between $110 and $130 would increase recession risks, reduce global economic growth, maintain inflationary pressure, and keep financial markets highly volatile. On the other hand, a diplomatic breakthrough, successful ceasefire, expanded production from OPEC+, increased U.S. shale output, or reopening of key shipping routes could quickly reduce the geopolitical premium, allowing Brent to retreat toward $90 or even $80 over time.
For crypto investors, survival during periods of uncertainty is often more important than maximizing short-term returns. Conservative position sizing, disciplined risk management, diversified exposure, staggered buying strategies, and maintaining sufficient liquidity can help navigate prolonged volatility. Once oil prices stabilize, inflation expectations moderate, and central banks eventually begin easing monetary policy, liquidity conditions could improve dramatically. Historically, Bitcoin has often begun recovering months before the first official rate cut as investors anticipate easier financial conditions. Those who preserve capital during today's uncertainty may ultimately be best positioned to benefit from the next major bull cycle in both traditional and digital asset markets.@Gate_Square #SummerCreationCamp
repost-content-media
  • Reward
  • 2
  • Repost
  • Share
Lock_433:
DYOR 🤓
View More
#IntelQ2RevenueSurges25%
Intel's Biggest Comeback in 15 Years?
Intel has officially delivered one of the most surprising earnings reports in the semiconductor industry, proving that the turnaround story is becoming more than just a promise. After years of losing market share, suffering manufacturing delays, and falling behind competitors in AI infrastructure, the company is finally showing measurable operational improvements. Revenue has returned to strong double-digit growth, profitability is improving rapidly, AI-related demand continues accelerating, and the new management team is executi
HighAmbition
#IntelQ2RevenueSurges25%
Intel's Biggest Comeback in 15 Years?
Intel has officially delivered one of the most surprising earnings reports in the semiconductor industry, proving that the turnaround story is becoming more than just a promise. After years of losing market share, suffering manufacturing delays, and falling behind competitors in AI infrastructure, the company is finally showing measurable operational improvements. Revenue has returned to strong double-digit growth, profitability is improving rapidly, AI-related demand continues accelerating, and the new management team is executing a disciplined transformation strategy that investors have been waiting to see for years. While risks remain significant, Intel has clearly moved from survival mode into the rebuilding phase, making it one of the most closely watched semiconductor companies heading into the second half of 2026.
Q2 2026 Earnings Shocked Wall Street
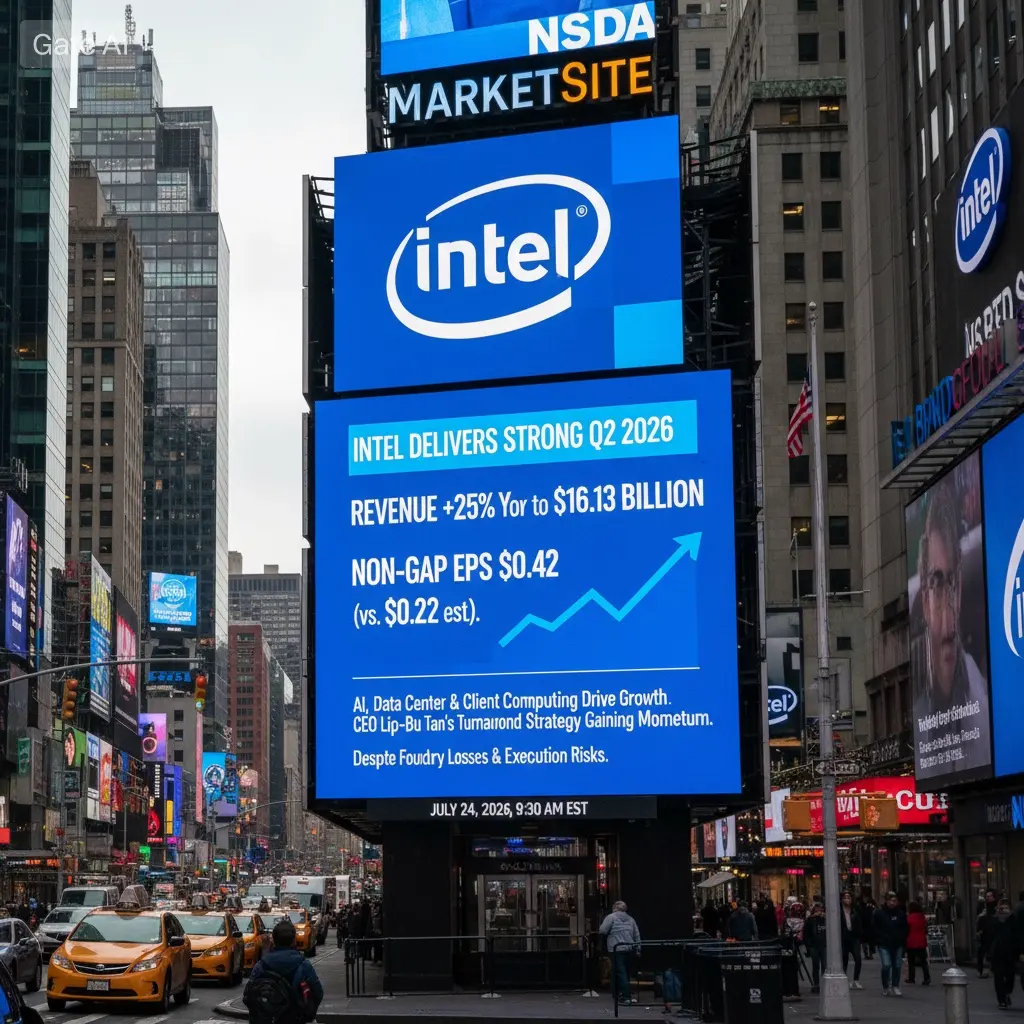
Intel reported $16.13 billion in Q2 revenue, representing approximately 25.4% year-over-year growth, the strongest quarterly revenue expansion since 2011. The company also delivered Non-GAAP EPS of $0.42, crushing analyst expectations near $0.22, an earnings surprise of almost 92%. Just one year ago Intel reported a Non-GAAP loss, making this turnaround even more impressive.
Operating cash flow climbed to roughly $7.0 billion, comfortably above expectations, while Non-GAAP gross margin improved from 29.7% last year to 41.8%, reflecting dramatically better manufacturing efficiency, stronger product mix, and improving factory utilization. Operating margin also swung from -3.9% to 17.2%, showing that Intel's restructuring efforts are finally translating into real financial improvement.
Although GAAP EPS remained deeply negative because of a massive non-cash CHIPS Act accounting adjustment worth around $13.6 billion, most professional investors focused on operating performance rather than accounting noise.
Business Segments Driving Growth
Intel's recovery is no longer dependent on a single business.
Client Computing Group (CCG) generated nearly $8.9 billion, growing 13% YoY, supported by continued demand for Core Ultra processors designed for AI PCs, robotics, industrial computing, and enterprise systems.
The biggest star was the Data Center & AI division, producing approximately $6.3 billion in revenue with an exceptional 59% annual growth rate. Demand for Xeon processors, AI infrastructure, cloud computing, enterprise inference workloads, and hyperscale deployments continues strengthening despite intense competition from AMD and NVIDIA.
Intel Foundry generated roughly $5.8 billion in revenue, up 31% YoY. External foundry revenue remains relatively small, but management continues improving yields while reducing long-term operating losses. Although the foundry still lost around $2.1 billion during the quarter, investors increasingly believe profitability is achievable over the coming years if execution continues.
Lip-Bu Tan Is Changing Intel's Culture
CEO Lip-Bu Tan has transformed Intel's operating philosophy since taking leadership.
Instead of spending aggressively without guaranteed returns, Tan introduced a disciplined "no blank check" investment strategy. Future manufacturing expansion now depends on confirmed customer commitments before billions of dollars are invested.
The company has reduced R&D and SG&A expenses significantly, simplified organizational layers, completed most workforce restructuring, accelerated decision making, and improved accountability across every business unit.
Rather than chasing market share at any cost, Intel is focusing on profitable growth, manufacturing efficiency, customer satisfaction, AI infrastructure, advanced packaging, and long-term cash generation.
This cultural transformation may ultimately become more valuable than any single product launch.
18A Process Technology Could Be Intel's Biggest Competitive Weapon
Perhaps the most important milestone is Intel's 18A process technology.
Risk production has successfully begun while Panther Lake processors are entering high-volume manufacturing using ASML High-NA EUV lithography. If Intel executes this roadmap successfully, it will validate years of investment aimed at regaining manufacturing leadership.
18A is expected to improve performance, reduce power consumption, and strengthen Intel's position in notebooks, AI PCs, enterprise computing, and future server products.
Investors are watching manufacturing yields extremely closely because successful 18A execution could dramatically improve investor confidence and eventually attract major external foundry customers.
Advanced Packaging: Intel's Secret AI Advantage
While much attention focuses on manufacturing nodes, Intel's advanced packaging strategy may become one of its strongest competitive advantages.
Projects across Malaysia, New Mexico, and South Korea are expanding Intel's capacity for EMIB and Foveros technologies.
Unlike traditional approaches, Intel's EMIB architecture enables extremely large AI chip designs without requiring expensive full-size silicon interposers, offering potentially better scalability and lower production costs.
Intel has already demonstrated packaging designs exceeding 10,000 mm², opening opportunities for next-generation AI accelerators, supercomputers, cloud infrastructure, defense applications, and custom silicon customers.
As AI chips become increasingly complex, packaging itself could become one of the industry's highest-margin businesses.
Global Expansion Continues
Intel also announced approximately €5 billion ($5.7 billion) in additional investment for its Irish manufacturing campus while maintaining approximately $20 billion in planned 2026 capital expenditure.
Management continues expanding manufacturing capacity across the United States and Europe while strengthening partnerships with Foxconn, SambaNova, and multiple hyperscale customers.
These investments position Intel for long-term AI infrastructure demand rather than short-term cyclical recovery.
Current Stock Performance
Intel currently trades around $91-$97, after reaching highs above $142 earlier this year.
The stock has gained roughly 170% during 2026 following an impressive 84% advance in 2025, making Intel one of the strongest-performing large-cap semiconductor stocks over the last two years.
Following earnings, shares initially surged above $106, but profit-taking and concerns regarding foundry losses triggered a healthy pullback.
Despite this correction, the long-term trend remains constructive as improving fundamentals continue supporting investor confidence.
Technical Analysis
Current technical structure remains cautiously bullish.
Support Levels • $98 (major neckline) • $91-$95 (current demand zone) • $85 (strong trend support) • $55 (long-term structural support)
Resistance Levels • $105-$112 • $120 • $133-$142 (major historical resistance)
RSI remains near 64, suggesting bullish momentum without entering extreme overbought territory.
MACD continues printing positive momentum while volume accumulation remains healthy, indicating institutional participation has not
disappeared despite recent consolidation.
2026-2027 Price Outlook
Bullish Scenario
If Intel successfully commercializes 18A, wins meaningful external foundry customers, expands AI server market share, and narrows foundry losses faster than expected, shares could recover toward $120-$142, while an exceptionally strong execution cycle could eventually push the stock toward $150-$200.
Base Scenario
If execution remains steady without major surprises, Intel could gradually trade between $100-$120 over the next 12 months as profitability improves and investor confidence increases.
Bearish Scenario
If manufacturing delays return, foundry losses widen, AMD gains additional server market share, or AI spending slows significantly, shares could revisit the $70-$85 region before stabilizing.
What Traders Are Watching
The market is no longer debating whether Intel is improving—it is debating how valuable that improvement will ultimately become.
Bullish investors highlight: • 25% revenue growth • 59% AI/Data Center growth • Massive margin expansion • Strong operating cash flow • Better manufacturing execution • Improving management discipline • AI infrastructure demand
..
Bearish investors remain concerned about: • Continued Foundry losses • Premium valuation • Execution risk • AMD competition • NVIDIA's AI dominance • High capital expenditure • Possible macro slowdown
The truth probably lies somewhere between both extremes. Intel has unquestionably repaired much of its operational foundation, but sustaining premium valuation requires continued flawless execution over multiple quarters.
Final Outlook
Intel today looks fundamentally different from the company investors criticized only two years ago. Revenue growth has accelerated, profitability is recovering, manufacturing execution has improved, AI demand continues expanding, and management has restored confidence through disciplined capital allocation rather than ambitious promises.
The next major catalysts include Panther Lake commercialization, additional 18A progress, external foundry customer announcements, AI accelerator expansion, improving foundry profitability, and continued strength in Data Center revenue.
For long-term investors, Intel remains one of the semiconductor sector's highest-risk but also potentially highest-reward turnaround opportunities. If management continues executing at the current pace, today's recovery story could eventually evolve into one of the largest corporate transformations the technology industry has witnessed in more than a decade.@Gate_Square #SummerCreationCamp
repost-content-media
  • Reward
  • Comment
  • Repost
  • Share
#UStoImpose10To12.5PercentTariffsOn60Economies
Trump's administration has imposed new tariffs ranging from 10% to 12.5% on 60 economies, effective July 24, 2026. This aggressive trade policy shift is sending shockwaves through global financial markets, with significant implications for both traditional equities and the cryptocurrency sector.
The tariff structure creates a two-tier system. Seventeen economies that have committed to enforcing forced labor import prohibitions face a 10% tariff rate, including Canada, India, Mexico, and the United Kingdom. The remaining countries, including major
BTC0.37%
ETH0.80%
HighAmbition
#UStoImpose10To12.5PercentTariffsOn60Economies
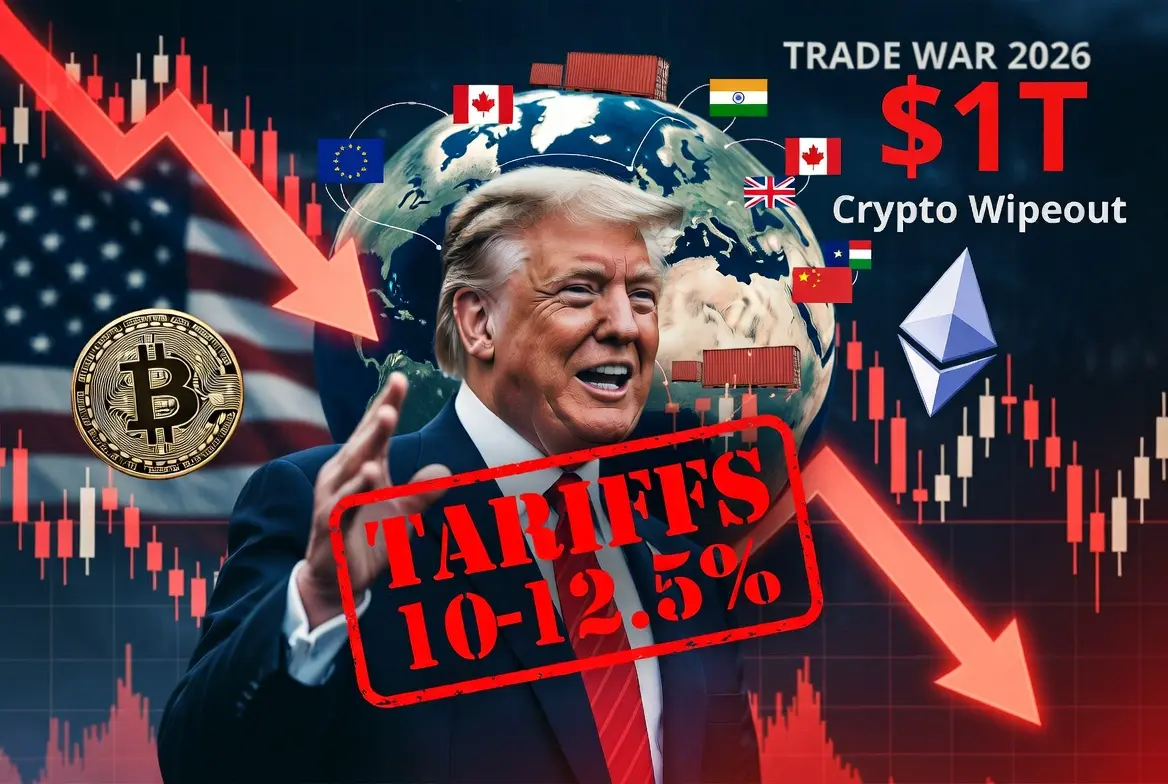
Trump's administration has imposed new tariffs ranging from 10% to 12.5% on 60 economies, effective July 24, 2026. This aggressive trade policy shift is sending shockwaves through global financial markets, with significant implications for both traditional equities and the cryptocurrency sector.
The tariff structure creates a two-tier system. Seventeen economies that have committed to enforcing forced labor import prohibitions face a 10% tariff rate, including Canada, India, Mexico, and the United Kingdom. The remaining countries, including major trading partners like the European Union, Japan, South Korea, Switzerland, and Taiwan, are hit with a steeper 12.5% rate. This differentiation attempts to pressure nations into aligning with US labor standards while maintaining leverage through punitive trade measures.
The immediate market reaction has been pronounced. According to Yale Budget Lab estimates, these tariffs will cost the average American household between $550 and $1,500 annually. Consumer prices are projected to rise by 0.4% to 1.1%, with apparel, footwear, metals, electronics, and automobiles bearing the brunt of cost increases. The Atlantic Council projects these tariffs could generate up to $166 billion in annual revenue for the US government, but at the expense of global trade flows.
The cryptocurrency market has shown heightened sensitivity to these developments. Bitcoin, currently trading in the $64,000 to $66,000 range, has experienced significant volatility in response to tariff announcements. Historical data shows Bitcoin dropped 12.4% within two hours on October 10, 2025, when Trump announced 100% tariffs on Chinese imports, falling from approximately $124,714 to the $102,000 zone. This demonstrates how aggressively risk assets react to trade war escalations.
Current market conditions show Bitcoin down approximately 45.5% from its all-time high of $126,198 reached on October 6, 2025. Ethereum hovers near $1,750 to $1,900, down about 30.4% from its peak of $4,953. The total cryptocurrency market capitalization has shed approximately 25.9% from January 2026 highs, wiping out roughly $1 trillion in value.
The correlation between tariff announcements and crypto price action follows a predictable pattern. Short-term volatility spikes as investors flee risk assets, followed by periods of consolidation. Bitcoin dominance has climbed to approximately 57-59% as capital retreats from altcoins into the relative safety of the largest cryptocurrency. Ethereum has shown relative stability, with ETF inflows of approximately $70.5 million while Bitcoin ETFs experienced outflows, suggesting selective institutional interest rather than wholesale exit from digital assets.
The macroeconomic implications extend beyond immediate price movements. Tariffs function as taxes on imports, raising prices and slowing economic activity. This creates a stagflationary environment where inflation rises while growth falters. For cryptocurrencies, this presents a dual narrative. In the short term, reduced liquidity and risk-off sentiment pressure prices downward. However, the long-term thesis strengthens as Bitcoin's role as an inflation hedge and alternative store of value gains credibility.
Federal Reserve policy becomes the critical variable. If economic growth slows significantly, the Fed may pivot toward rate cuts, injecting liquidity that historically benefits risk assets including cryptocurrencies. Conversely, persistent inflation could force continued hawkish policy, maintaining pressure on speculative assets. The market currently prices in this uncertainty, with volatility expected to persist through the coming months.
Supply chain disruptions will particularly affect sectors critical to crypto infrastructure. Semiconductor shortages, already strained by geopolitical tensions, could worsen as tariffs on Asian manufacturing hubs take effect. Mining equipment, hardware wallets, and data center components face potential cost increases of 10% to 12.5%, indirectly raising operational costs for blockchain networks.
The regulatory dimension adds another layer of complexity. The Supreme Court's February 2026 ruling striking down Trump's previous emergency-powers tariffs forced this new approach under Section 301 of the Trade Act of 1974. Legal challenges are already emerging, with small businesses filing suits arguing these tariffs exceed presidential authority. Uncertainty around implementation creates additional market volatility.
For crypto investors, the strategic outlook requires balancing short-term caution against long-term opportunity. Technical analysis shows Bitcoin holding critical support at $58,000 to $60,000. A breakdown below this range could trigger deeper corrections toward $52,000 or lower. Conversely, reclaiming $70,000 would signal renewed bullish momentum. Ethereum's ability to maintain $1,500 to $1,600 support is equally crucial for altcoin market stability.
The tariff policy represents more than immediate price impact. It signals a structural shift toward economic nationalism that could reshape global capital flows for years. Countries affected by these tariffs may accelerate dedollarization efforts and explore alternative settlement systems, potentially benefiting decentralized finance protocols and non-dollar stablecoins over the medium term.
Institutional adoption continues despite macro headwinds. Corporate treasury allocations to Bitcoin, while slowing, have not reversed. The approval of spot ETFs in major markets created permanent infrastructure for institutional participation that persists through volatility cycles. This underlying demand provides a floor for prices even during risk-off periods.
Geopolitical escalation remains the wildcard. The concurrent tensions in the Middle East, with oil prices exceeding $85 per barrel and Brent crude closing above $100, compound inflationary pressures. Energy costs directly impact mining economics and data center operations, creating additional operational challenges for the crypto ecosystem.
The next 30 to 60 days will prove decisive. Trade negotiations, Fed policy signals, and geopolitical developments will determine whether current levels represent accumulation opportunities or the beginning of deeper corrections. Investors should monitor ETF flow data, futures funding rates, and on-chain metrics for early signals of trend reversals.
In conclusion, Trump's 10% to 12.5% tariffs on 60 economies create immediate headwinds for cryptocurrency markets through reduced liquidity and risk-off sentiment. Bitcoin and Ethereum face continued volatility with downside risks toward $58,000 and $1,500 respectively if support levels fail. However, the long-term structural case for digital assets as inflation hedges and alternatives to traditional finance strengthens as trade wars and currency conflicts intensify. The current environment favors patient capital with multi-year time horizons over short-term speculation.
@Gate_Square #SummerCreationCamp
repost-content-media
  • Reward
  • 2
  • Repost
  • Share
Lock_433:
DYOR 🤓
View More
#EsportsTradingSeason
#EsportsTradingSeason — Turn Your Game Knowledge Into Real Rewards on Gate
The 2026 summer esports season is electrifying the world. From the Esports World Cup to LPL and LCK showdowns, legendary titles like League of Legends, Counter-Strike 2, Dota 2, VALORANT, Honor of Kings, and PUBG are delivering unforgettable matches every single day. Now imagine turning your passion for these games into tangible rewards. That is exactly what Gate is offering through the Esports Trading Season — a limited-time campaign with a massive 200,000 USDT prize pool that lets you predict ou
HighAmbition
#EsportsTradingSeason
#EsportsTradingSeason — Turn Your Game Knowledge Into Real Rewards on Gate
The 2026 summer esports season is electrifying the world. From the Esports World Cup to LPL and LCK showdowns, legendary titles like League of Legends, Counter-Strike 2, Dota 2, VALORANT, Honor of Kings, and PUBG are delivering unforgettable matches every single day. Now imagine turning your passion for these games into tangible rewards. That is exactly what Gate is offering through the Esports Trading Season — a limited-time campaign with a massive 200,000 USDT prize pool that lets you predict outcomes of the biggest esports events and earn real incentives along the way. Whether you are a hardcore fan who knows every roster change or a casual viewer who just loves watching great matches, this campaign transforms your esports awareness into an opportunity you should not miss.
The campaign runs from July 20, 2026 at 08:00 UTC through August 10, 2026 at 08:00 UTC, giving you three full weeks of action. Participation is straightforward. Log in to your Gate account, visit the campaign page, and hit Register Now. Then navigate to the Gate Polymarket esports section through the Alpha area on the Gate App homepage. There you will find prediction markets covering individual matchups, tournament champions, and other outcomes across the hottest esports events. Use the USDT already in your account to place predictions on who will win, who will advance, or which team will claim the title. Every prediction you make counts toward your weekly task progress and your leaderboard ranking, meaning each trade is a step closer to rewards.
Let me break down the three ways you can earn within this campaign, because understanding these details is key to maximizing what you walk away with.
Campaign 1 is the New Esports Prediction User Reward, designed specifically for first-timers. If you have never tried Polymarket esports predictions before, this is your welcoming gift. Complete your first prediction trade of at least 100 USDT in any eligible esports market, and you receive a 5 USDT Prediction Voucher instantly. This offer is limited to the first 500 eligible users, so early registration matters. That 5 USDT voucher can then be used to place additional predictions, effectively giving you free capital to explore more markets and build confidence in the system before committing larger amounts. It is a smart onboarding mechanism that rewards curiosity and initiative.
Campaign 2 is the Weekly Prediction Trading Tasks, which resets every seven days from your registration time and runs for three consecutive weeks. This structure means you have three independent chances to hit volume targets and unlock vouchers. The weekly targets and their corresponding rewards are clearly scaled. Reach 5,000 USDT in weekly cumulative prediction trading volume and you unlock a 5 USDT Prediction Voucher. Hit 20,000 USDT and the voucher jumps to 10 USDT. At 50,000 USDT you earn a 20 USDT voucher. The serious traders who push to 200,000 USDT in a single week receive a 100 USDT voucher, and those who reach the elite 500,000 USDT threshold earn a 200 USDT voucher. These vouchers can only be used within eligible Gate Polymarket esports markets and cannot be withdrawn, transferred, or redeemed for cash, but they serve as powerful fuel for more predictions. Importantly, weekly task rewards can be stacked alongside leaderboard rewards and any championship prediction incentives, so nothing cancels out anything else. Each week is a fresh opportunity, and the progressive scale means even moderate activity earns something back while high-volume trading unlocks substantial bonus capital.
Campaign 3 is the Esports Prediction Trading Leaderboard, and this is where the biggest prizes live. After the campaign concludes, the top 100 users by cumulative valid prediction trading volume who also meet minimum volume thresholds will share 50,000 USDT. The distribution is dramatic at the top. First place receives 10,000 USDT provided they have reached at least 10 million USDT in cumulative volume. Second place earns 6,000 USDT with a 6 million minimum. Third place takes 4,000 USDT with a 4 million minimum. Ranks 4 through 10 share 10,000 USDT equally among themselves, each requiring at least 1 million in volume. Ranks 11 through 30 share another 10,000 USDT equally with a 100,000 minimum. Ranks 31 through 100 share 10,000 USDT proportionally based on each user's volume relative to the group total, with a 10,000 minimum threshold. This means even if you are not pushing millions in volume, reaching the 31 to 100 tier with consistent activity can still deliver a meaningful reward slice. The leaderboard is determined strictly by cumulative valid prediction trading volume. If two users hold the same volume, the one who reached it first gets the higher rank. Anyone who ranks within a reward tier but falls short of the minimum volume requirement for that tier will not receive the reward, and undistributed amounts will not be reallocated. Final rankings are based on Gate's backend records and are definitive.
Beyond these three structured campaigns, the total event prize pool of 200,000 USDT includes the leaderboard's 50,000 plus newcomer rewards, weekly vouchers, and any additional championship prediction incentives running concurrently. This is not a token gesture. It is a serious commitment from Gate to the esports community, bridging competitive gaming excitement with financial opportunity in a way that few platforms have attempted at this scale.
The esports titles covered span the most watched competitive games on the planet. League of Legends with its LPL, LCK, and international circuits. Counter-Strike 2 at the Esports World Cup and beyond. Dota 2 with its prestigious ESL Pro Tour championship. VALORANT's growing tournament ecosystem. Honor of Kings expanding globally. PUBG's battle royale competitions. Each of these games generates dozens of predictable outcomes every week — which team wins a series, which player tops the kill leaderboard, which region claims the championship trophy. The Polymarket format lets you trade on these outcomes with USDT, and the market pricing itself reflects the community's collective assessment of probabilities, giving you real-time sentiment data to inform your own predictions.
For anyone who has spent years watching esports, studying team meta strategies, tracking roster substitutions, and understanding how map pools affect outcomes, this campaign is your chance to put that knowledge to work. The edge you already have as a fan — knowing that a particular team thrives on a specific map, recognizing when a star player is in peak form, understanding coaching style differences — translates directly into better prediction decisions and therefore higher trading volume returns on the leaderboard. Casual fans benefit too. The newcomer voucher gives you a risk-free entry point to learn how prediction markets work, and the weekly tasks reward consistency over heroics. You do not need to be a whale to participate meaningfully.
A few important conditions to keep in mind. You must register on the campaign page and complete identity verification to qualify. Only trades made after successful registration count. Prediction Vouchers from weekly tasks are distributed automatically after each weekly cycle ends. Leaderboard rewards are distributed within 14 business days after the campaign concludes and markets settle. Wash trading, self-trading, matched trading, and market manipulation are strictly prohibited and will disqualify you. Multiple accounts under the same verified identity are treated as one participant. API users, market makers, corporate and institutional accounts are not eligible. This campaign is organized independently by Gate and is not affiliated with or endorsed by EWC, tournament organizers, or game publishers. Prediction market services may have regional restrictions, so verify your eligibility based on your jurisdiction. This is not investment advice or a guarantee of returns. Prediction markets carry price volatility, liquidity, settlement, and compliance risks. Participate thoughtfully.
The timing is perfect. Major esports tournaments are running right now through early August, which means there is a constant stream of prediction opportunities throughout the entire campaign window. Every day brings new matches, new markets, and new chances to accumulate volume and climb the leaderboard. Three weeks of nonstop esports action paired with a 200,000 USDT prize pool is a rare alignment. If you have been watching esports without ever finding a way to monetize your fandom, this is the door that just opened. Register, predict, trade, and let the games you love pay you back.
@Gate_Square #SummerCreationCamp
repost-content-media
  • Reward
  • 1
  • Repost
  • Share
Lock_433:
2026 GOGOGO 👊
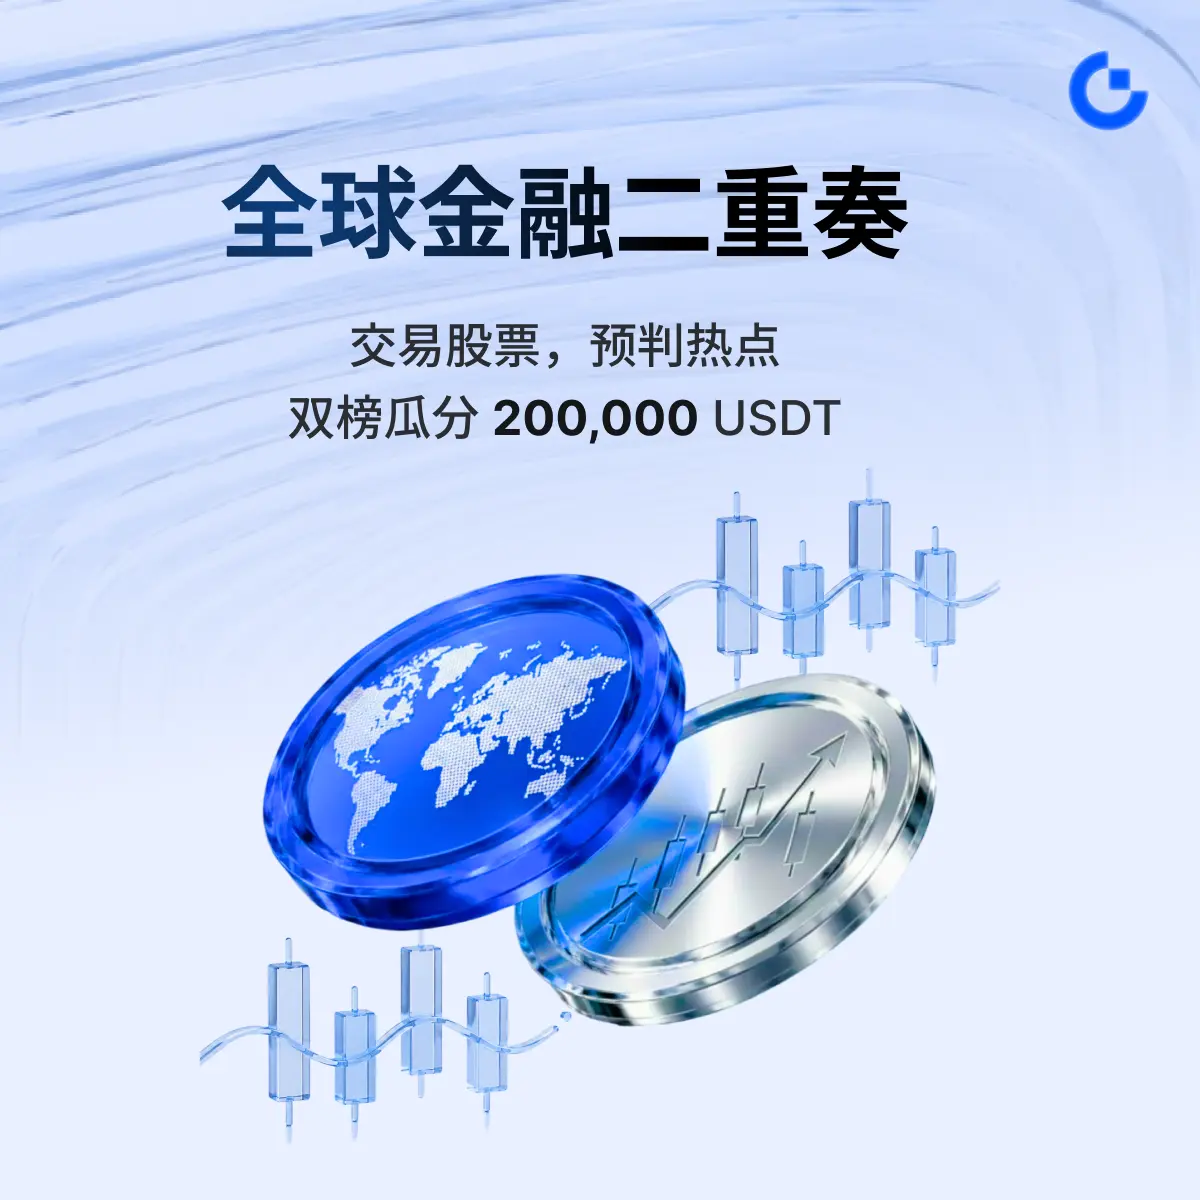
🌍 Gate’s “Global Finance Double Concerto” is officially live!
Trade global stocks, anticipate financial hotspots, and share rewards from two leaderboards totaling 200,000 USDT.
1️⃣ Trade U.S. stocks, Hong Kong stocks, and Korean stocks to target the weekly stock trading leaderboard
2️⃣ Participate in earnings reports, CPI, index and stock price predictions to target the Polymarket prediction weekly leaderboard
3️⃣ On both leaderboards, up to 20,000 USDT can be unlocked weekly for each; rewards are stackable
4️⃣ Extra rewards for first trades by new users, VIP sign-ups, and event sharing
⏰ Eve
HighAmbition
🌍 Gate’s “Global Finance Double Concerto” is officially live!
Trade global stocks, anticipate financial hotspots, and share rewards from two leaderboards totaling 200,000 USDT.
1️⃣ Trade U.S. stocks, Hong Kong stocks, and Korean stocks to target the weekly stock trading leaderboard
2️⃣ Participate in earnings reports, CPI, index and stock price predictions to target the Polymarket prediction weekly leaderboard
3️⃣ On both leaderboards, up to 20,000 USDT can be unlocked weekly for each; rewards are stackable
4️⃣ Extra rewards for first trades by new users, VIP sign-ups, and event sharing
⏰ Event period: July 24, 2026 18:00 - August 28, 2026 18:00 (UTC+8)
👉 Join now: https://www.gate.com/competition/Trade-Predict/s1
repost-content-media
  • Reward
  • Comment
  • Repost
  • Share
#IntelQ2RevenueSurges25%
Intel Q2 2026 Earnings: AI Boom Powers the Fastest Growth in Over a Decade — Is Intel Entering a New Bull Cycle?
Intel has delivered one of the biggest earnings surprises of 2026, reinforcing the narrative that artificial intelligence is reshaping the semiconductor industry far beyond GPU manufacturers. The company's second-quarter earnings, released on July 23, 2026, demonstrated that Intel is benefiting from the accelerating demand for AI infrastructure, enterprise computing, cloud expansion, and foundry services. After years of restructuring and intense competition
HighAmbition
#IntelQ2RevenueSurges25%
Intel Q2 2026 Earnings: AI Boom Powers the Fastest Growth in Over a Decade — Is Intel Entering a New Bull Cycle?
Intel has delivered one of the biggest earnings surprises of 2026, reinforcing the narrative that artificial intelligence is reshaping the semiconductor industry far beyond GPU manufacturers. The company's second-quarter earnings, released on July 23, 2026, demonstrated that Intel is benefiting from the accelerating demand for AI infrastructure, enterprise computing, cloud expansion, and foundry services. After years of restructuring and intense competition, Intel is now showing tangible evidence that its turnaround strategy is beginning to produce measurable financial results.
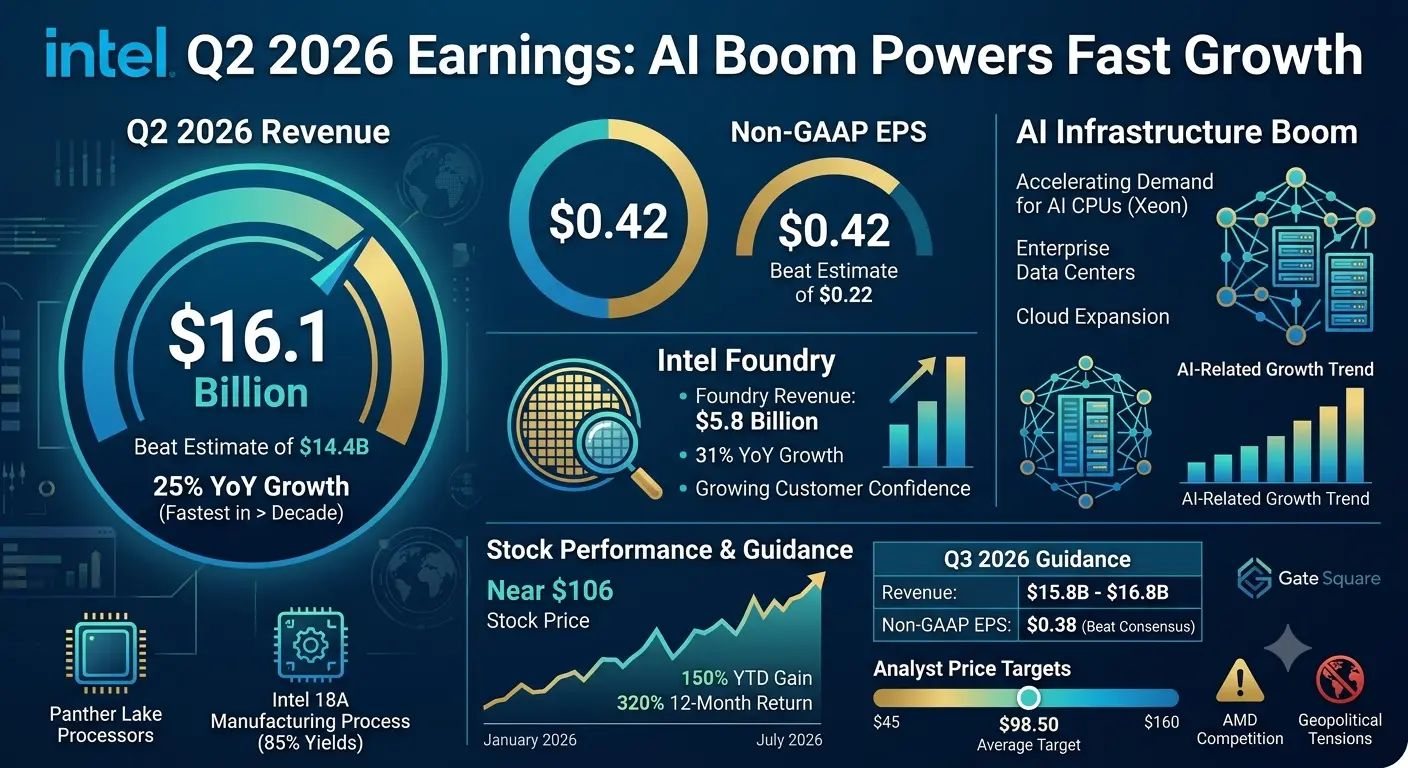
The market responded positively because this was not simply a revenue beat—it represented broad-based operational improvement across multiple business segments. Revenue reached a record 16.1 billion dollars, exceeding Wall Street expectations of 14.4 billion dollars by nearly 1.7 billion dollars. Revenue increased 25% year over year, marking Intel's strongest quarterly growth since 2011. Non-GAAP earnings per share came in at 0.42 dollars, almost double the analyst consensus of 0.22 dollars, while GAAP operating income reached 1.796 billion dollars, translating into an operating margin of 11.1%. Cash flow from operations climbed to 7.0 billion dollars, highlighting the company's improving financial flexibility and ability to continue investing in advanced manufacturing.
One of the biggest contributors to this performance was Intel Foundry. Revenue from the foundry business surged 31% year over year to 5.8 billion dollars, indicating growing customer confidence in Intel's manufacturing roadmap. This is particularly significant because Intel's long-term strategy depends not only on selling processors but also on becoming a major global semiconductor manufacturer capable of competing with TSMC and Samsung. Every quarter of sustained foundry growth increases investor confidence that Intel can establish itself as one of the world's leading contract chip manufacturers.
Artificial intelligence continues to be the primary growth engine. While Nvidia dominates AI accelerators and GPUs, Intel has started benefiting from the explosive demand for CPUs supporting AI servers, enterprise infrastructure, edge computing, and cloud deployments. Large enterprises are investing heavily in AI-ready data centers, increasing demand for Xeon processors and advanced server platforms. As AI adoption expands globally, Intel is positioned to benefit from infrastructure spending across multiple industries rather than relying solely on consumer PC sales.
Intel also strengthened its strategic partnerships during the quarter. The company expanded collaboration with Google Cloud to optimize AI infrastructure while also securing a significant manufacturing agreement with a major hyperscale cloud provider. These agreements improve revenue visibility over the coming years and validate Intel's manufacturing capabilities. Such partnerships may encourage additional customers to adopt Intel Foundry Services as companies seek supply-chain diversification outside Taiwan.
Management's guidance for Q3 further increased investor optimism. Intel expects revenue between 15.8 billion and 16.8 billion dollars, comfortably above Wall Street estimates. Expected Non-GAAP EPS of 0.38 dollars also exceeded consensus expectations of 0.27 dollars, suggesting that management sees continued demand strength rather than a temporary earnings spike. Guidance often carries more weight than historical earnings because it reflects management's confidence in future business conditions.
Intel stock has reflected this improving outlook. Shares currently trade near 106 dollars, giving the company a market capitalization above 477 billion dollars. Since January 2026, the stock has gained approximately 150%, while the twelve-month return has exceeded 320%, making Intel one of the strongest-performing semiconductor companies this year. Such a dramatic recovery illustrates how quickly investor sentiment can change when operational execution improves.
Wall Street remains divided on Intel's valuation despite recent strength. The average analyst target sits around 98.50 dollars, slightly below the current market price. However, several firms remain highly bullish. Susquehanna increased its target from 80 dollars to 115 dollars after the earnings report. Citi maintains a target of 130 dollars, while Tigress Financial projects 140 dollars. Morgan Stanley remains more cautious with a 75 dollar target, and Loop Capital continues to hold one of the most bearish views at 25 dollars. Overall, published targets range from 45 dollars to 160 dollars, highlighting how uncertain Intel's long-term outlook remains despite improving fundamentals.
From a technical perspective, Intel continues to display constructive price action. The stock previously formed a double-top pattern near 133.15 dollars, leading to a healthy correction before stabilizing. The neckline around 98 dollars now serves as major support. As long as shares remain above this level, the longer-term uptrend remains intact. Immediate resistance lies near 115 dollars, followed by the psychologically important 130 dollar level. The stock continues trading above both its 50-day and 200-day moving averages, confirming a bullish long-term trend. Rising volume after earnings indicates increased institutional participation, which often strengthens the sustainability of price trends.
Momentum indicators suggest that bullish sentiment remains dominant, although short-term overbought conditions may lead to temporary pullbacks. Traders should watch whether any correction occurs on declining volume, as that would indicate healthy profit-taking rather than a reversal of the broader trend.
Several important catalysts could drive Intel's next phase of growth. The upcoming Panther Lake processor launch is expected to strengthen Intel's competitive position in client computing. Intel's 18A manufacturing process has reportedly achieved approximately 85% production yields, representing a significant milestone in manufacturing efficiency. Higher yields reduce production costs, improve margins, and increase customer confidence. Continued expansion of AI workloads, enterprise digital transformation, edge computing, autonomous systems, and cloud infrastructure should further support long-term processor demand.
Nevertheless, investors should remain aware of several risks. AMD continues gaining market share in high-performance server processors and could pressure pricing. TSMC remains the global leader in advanced manufacturing technology, creating intense competitive pressure for Intel Foundry Services. Geopolitical tensions involving semiconductor supply chains remain an ongoing uncertainty. Consumer PC demand has not fully stabilized and could weigh on Intel's Client Computing Group if economic conditions weaken. Although operating profitability has improved significantly, Intel still reported a substantial GAAP net loss of approximately 11 billion dollars, reminding investors that the turnaround is still underway rather than fully complete.
For traders, several strategies can be considered depending on risk tolerance. Conservative investors may wait for pullbacks toward the 98 dollar support zone before accumulating shares. Swing traders could target the 115 dollar resistance initially, with a secondary objective around 130 dollars if momentum remains strong. Long-term investors may prefer a dollar-cost averaging approach, gradually building positions while reducing the impact of volatility. A stop-loss below 95 dollars would help manage downside risk should the technical structure fail.
Looking beyond 2026, analyst expectations remain optimistic. Base-case forecasts generally place Intel between 90 and 105 dollars by year-end after periods of consolidation.
Moderate valuation models project 90.97 to 104.82 dollars, while highly optimistic scenarios suggest prices could eventually exceed 221 dollars if Intel's foundry expansion achieves sustained success. Longer-term forecasts extending toward 2030 envision valuations approaching 259 dollars, assuming Intel successfully executes its manufacturing roadmap, captures meaningful foundry market share, and maintains leadership in AI infrastructure. Consensus estimates currently expect approximately 11.4% annual revenue growth for full-year 2026.
Overall, Intel's Q2 2026 earnings represent one of the strongest signs yet that the company's multi-year turnaround strategy is gaining momentum. Strong revenue growth, expanding operating margins, rising foundry revenue, improving manufacturing yields, healthy cash generation, and optimistic forward guidance collectively strengthen the investment case. While competitive pressures from AMD, Nvidia, and TSMC remain significant, Intel is demonstrating that it can still compete effectively in the AI era.
The coming quarters will be critical. Investors should closely monitor Panther Lake adoption, Intel Foundry customer wins, progress of the 18A manufacturing process, AI server demand, cloud partnerships, quarterly cash flow, operating margins, and overall execution. If management continues delivering results at this pace, Intel may transition from being viewed as a turnaround story to becoming one of the semiconductor sector's strongest long-term growth companies.@Gate_Square #SummerCreationCamp
repost-content-media
  • Reward
  • Comment
  • Repost
  • Share
#SKHynixADRIndicativePrice149
Comprehensive Analysis of SK Hynix ADR: Investment Opportunity in the Semiconductor Sector
Understanding ADR (American Depositary Receipt)
An American Depositary Receipt, commonly known as ADR, is a financial certificate that represents shares of a non-American company trading on the United States stock market. This innovative financial instrument allows American investors to invest in foreign companies without directly accessing international markets. Through ADRs, investors can purchase shares of companies listed on foreign exchanges while enjoying the convenie
HighAmbition
#SKHynixADRIndicativePrice149
Comprehensive Analysis of SK Hynix ADR: Investment Opportunity in the Semiconductor Sector
Understanding ADR (American Depositary Receipt)
An American Depositary Receipt, commonly known as ADR, is a financial certificate that represents shares of a non-American company trading on the United States stock market. This innovative financial instrument allows American investors to invest in foreign companies without directly accessing international markets. Through ADRs, investors can purchase shares of companies listed on foreign exchanges while enjoying the convenience of trading in US dollars and settling through American clearing systems. The ADR structure eliminates the complexities of cross-border transactions, currency conversions, and foreign regulatory compliance that typically burden international investments.
SK Hynix: A Global Semiconductor Powerhouse
SK Hynix stands as one of South Korea's largest and most influential semiconductor manufacturers, specializing in the production of NAND and DRAM memory chips. The company ranks as the world's second-largest memory chip manufacturer, making it a critical player in the global technology supply chain. Their products power everything from smartphones and computers to data centers and artificial intelligence applications. As a major supplier to tech giants worldwide, SK Hynix occupies a strategic position in the semiconductor industry that continues to grow in importance as digital transformation accelerates across all sectors of the economy.
Understanding Indicative Price
The term indicative price refers to an estimated or approximate price level rather than the final market price. This projection serves as a reference point before trading begins or during active trading sessions. It represents market expectations based on various factors including pre-market demand, analyst forecasts, and prevailing market sentiment. Investors should understand that indicative prices are not guaranteed execution prices but rather guidance that helps formulate trading strategies and expectations.
Current Market Position and Price Analysis
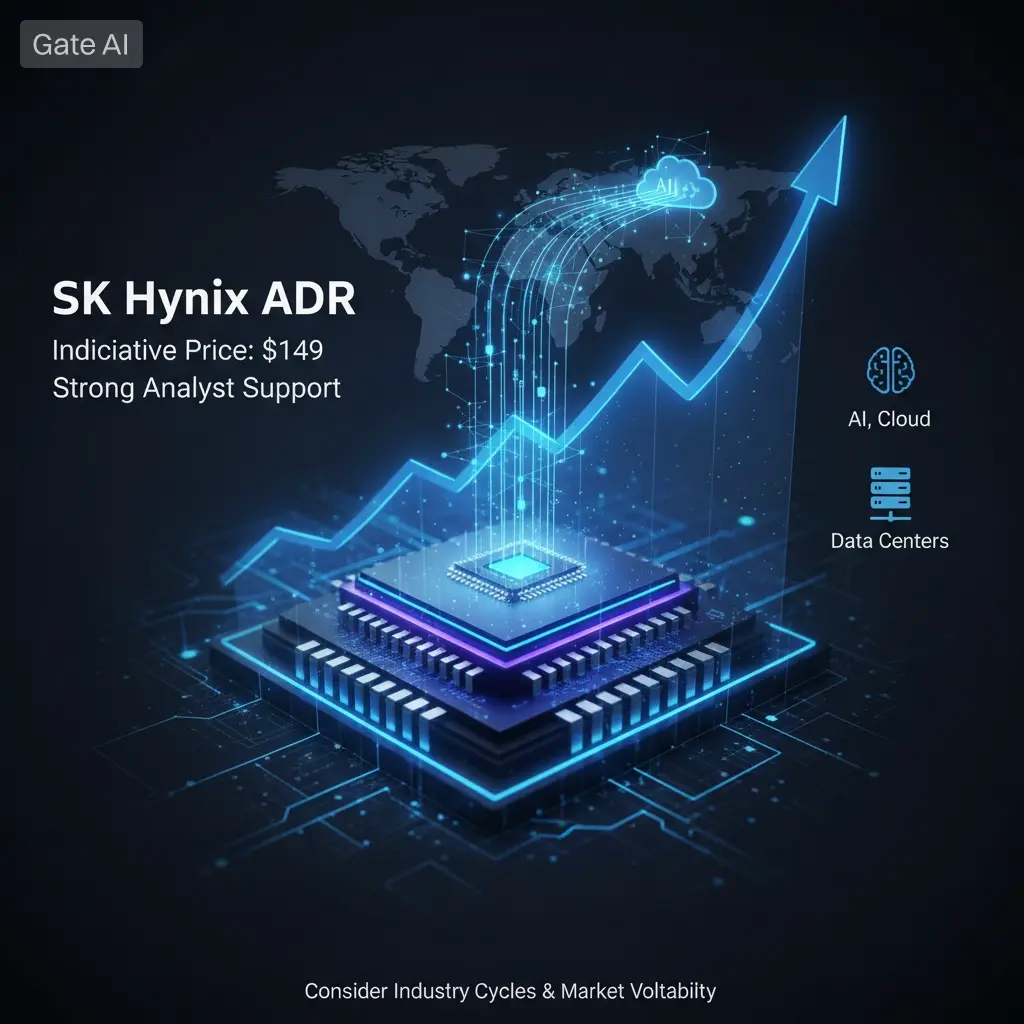
SK Hynix ADR has recently entered the US market with significant attention from institutional and retail investors alike. The indicative price of 149 USDT represents a key reference level that traders are monitoring closely. When the actual market price trades above this indicative level, it signals positive momentum and bullish sentiment among market participants. Conversely, if the price remains below 149 USDT, it may indicate weaker demand or negative market sentiment requiring careful evaluation.
Analyst Consensus and Price Targets
According to comprehensive analyst coverage from major financial institutions, SK Hynix demonstrates strong bullish sentiment across the investment community. Current consensus among 37 analysts shows an overwhelming majority recommending purchase positions. Specifically, 35 analysts have issued buy ratings, 1 maintains a hold position, and only 1 suggests selling. This distribution reflects strong confidence in the company's growth trajectory and market position.
The average 12-month price target from analysts stands at approximately 3,221,475 Korean Won, representing a potential upside of 47.77 percent from current levels. The price target range extends from a conservative low estimate of 1,030,000 Korean Won to an optimistic high forecast of 4,700,000 Korean Won. This wide range reflects varying assumptions about memory chip demand, pricing cycles, and global economic conditions.
Major Institutional Ratings
Several prominent financial institutions have provided detailed coverage of SK Hynix. Macquarie maintains an outperform rating with a price target of 4,000,000 Korean Won, suggesting 83.49 percent upside potential. CLSA has issued a high conviction outperform rating with a target of 3,700,000 Korean Won, indicating 69.72 percent upside. Bernstein SocGen Group maintains an outperform position with a 3,300,000 Korean Won target, representing 51.38 percent upside. Goldman Sachs continues to recommend buying with a price target of 3,500,000 Korean Won, suggesting 60.55 percent potential gains.
Trading Strategy Considerations
For investors considering SK Hynix ADR positions, several strategic approaches merit consideration. Entry timing becomes crucial given the volatile nature of semiconductor stocks and their sensitivity to technology cycles. Dollar cost averaging can help mitigate timing risk by spreading purchases across multiple entry points. Position sizing should reflect individual risk tolerance, with semiconductor investments typically suited for growth-oriented portfolios rather than conservative income strategies.
Technical Analysis and Support Levels
From a technical perspective, monitoring key support and resistance levels provides valuable guidance for trading decisions. The 52-week trading range of 245,000 to 2,987,000 Korean Won demonstrates the stock's volatility and potential for significant price movements. Current price action near the 2,180,000 Korean Won level suggests consolidation as markets digest recent developments and await catalysts for the next directional move.
Future Price Forecast and Growth Potential
Looking ahead, SK Hynix appears positioned for continued growth driven by several fundamental factors. The artificial intelligence boom continues to drive unprecedented demand for high-bandwidth memory solutions where SK Hynix holds technological leadership. Data center expansion worldwide requires massive memory capacity increases, supporting long-term demand visibility. The company's technological roadmap includes advanced process nodes that should maintain competitive positioning against rivals.
Conversion Ratio and ADR Mechanics
Understanding the ADR structure proves essential for accurate position sizing and valuation. The SK Hynix ADR operates with a conversion ratio where 10 ADRs represent 1 common share, meaning each ADR equals 0.1 of a common share. This ratio affects how price movements in the underlying Korean shares translate to ADR price changes and must be factored into investment calculations.
Risk Factors and Considerations
Investors must acknowledge several risk factors when evaluating SK Hynix positions. The semiconductor industry experiences pronounced cyclicality with periods of oversupply leading to price declines and margin compression. Geopolitical tensions, particularly involving technology trade restrictions, can impact operations and market access. Currency fluctuations between the Korean Won and US Dollar create additional volatility for ADR investors beyond the underlying stock performance.
Market Sentiment and Investor Positioning
Current market sentiment toward SK Hynix remains predominantly positive, driven by the company's strong market position in high-growth segments. Institutional investors have shown increasing interest, with many viewing the recent ADR listing as an opportunity to gain exposure to a leading semiconductor name through familiar US market infrastructure. Retail participation has also increased as awareness of the company's technological leadership spreads.
Competitive Landscape Analysis
SK Hynix operates in a duopoly-like market structure for DRAM alongside Samsung Electronics, with these two Korean giants controlling the majority of global supply. In NAND flash memory, competition includes additional players, but SK Hynix maintains strong positioning through technological innovation and manufacturing efficiency. This market structure provides pricing power during periods of strong demand while requiring continuous investment to maintain technological leadership.
Financial Health and Operational Metrics
The company demonstrates strong financial health with robust cash generation supporting both dividend payments and substantial capital expenditure requirements. Memory chip manufacturing demands massive ongoing investments in fabrication facilities, and SK Hynix has consistently demonstrated ability to fund these investments while maintaining shareholder returns. Recent quarters have shown significant revenue growth and margin expansion as memory prices recovered from cyclical lows.
Investment Timeline and Outlook
For investors with longer time horizons, SK Hynix presents compelling exposure to secular growth trends in data generation, artificial intelligence, and cloud computing. These trends show no signs of abating and should support memory demand for years to come. Short-term traders may find opportunities in the stock's volatility, though this requires careful risk management and timing discipline.
Portfolio Integration Considerations
SK Hynix ADR can serve multiple roles within diversified portfolios. As a technology sector holding, it provides exposure to the semiconductor industry's growth potential. For investors seeking international diversification, the ADR format offers convenient access to Korean equity markets without currency conversion complications. The stock's correlation with global technology trends makes it suitable for growth-oriented investment strategies.
Monitoring Key Catalysts
Successful investment in SK Hynix requires monitoring several key catalysts that drive stock performance. Quarterly earnings reports provide updates on memory pricing trends, capacity utilization, and forward guidance. Product announcements regarding new memory technologies can signal competitive positioning changes. Broader macroeconomic indicators affecting technology spending offer context for demand forecasts.
Conclusion
SK Hynix ADR represents a significant opportunity for investors seeking exposure to the global semiconductor industry through a leading memory chip manufacturer. The current indicative price of 149 USDT serves as a reference point for evaluating entry opportunities, with analyst consensus suggesting substantial upside potential based on strong industry fundamentals and company-specific competitive advantages. The overwhelmingly positive analyst sentiment, combined with favorable industry trends supporting memory demand, positions SK Hynix as an attractive consideration for growth-oriented investors comfortable with technology sector volatility.
The conversion to ADR format on US markets enhances accessibility for American investors while maintaining the economic exposure to SK Hynix's operational performance. As the company continues to benefit from artificial intelligence infrastructure buildout and data center expansion, long-term investors may find current levels attractive for establishing positions in this critical technology supplier.
@Gate_Square
repost-content-media
  • Reward
  • 1
  • Repost
  • Share
HighAmbition:
Get on board now! 🚗
#StakeUSD1Earn8.88%APR
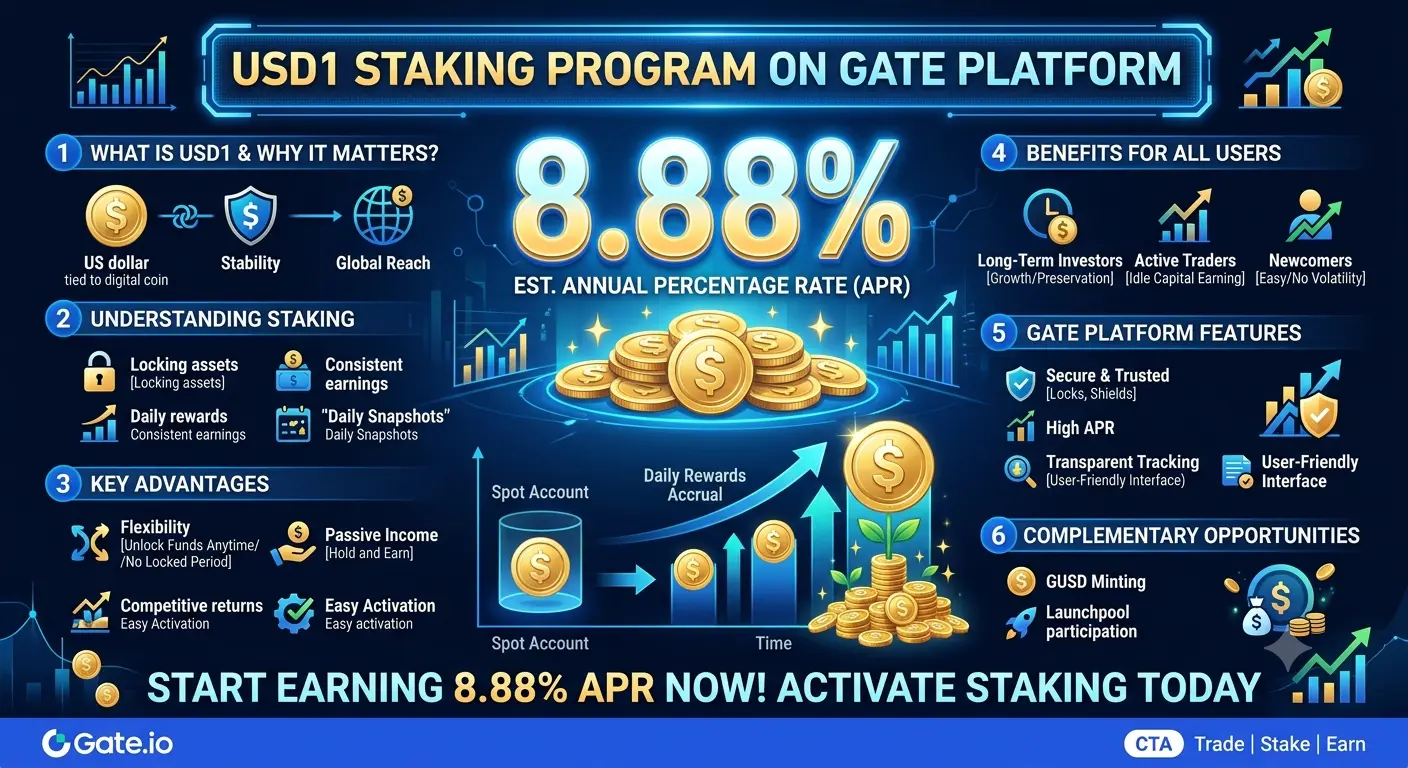
The USD1 Staking program on Gate represents one of the most attractive passive income opportunities available in the cryptocurrency ecosystem today. This comprehensive discussion will explore every aspect of this program, from its fundamental mechanics to its strategic advantages for investors, traders, and long-term holders.
What is USD1 and Why It Matters
USD1 is a stablecoin pegged to the United States Dollar, designed to maintain a one-to-one value ratio with the USD. Stablecoins have become the backbone of the cryptocurrency ecosystem, providing users with a safe h
HighAmbition
#StakeUSD1Earn8.88%APR
The USD1 Staking program on Gate represents one of the most attractive passive income opportunities available in the cryptocurrency ecosystem today. This comprehensive discussion will explore every aspect of this program, from its fundamental mechanics to its strategic advantages for investors, traders, and long-term holders.
What is USD1 and Why It Matters
USD1 is a stablecoin pegged to the United States Dollar, designed to maintain a one-to-one value ratio with the USD. Stablecoins have become the backbone of the cryptocurrency ecosystem, providing users with a safe haven during market volatility while maintaining the benefits of blockchain technology. Unlike volatile cryptocurrencies like Bitcoin or Ethereum, stablecoins offer price stability, making them ideal for earning passive income through staking programs.
The significance of USD1 lies in its dual nature: it combines the stability of traditional fiat currency with the flexibility and accessibility of digital assets. This makes it an excellent choice for users who want to preserve their capital while generating consistent returns.
Understanding Staking and APR
Staking in the cryptocurrency context refers to the process of locking up your digital assets in a platform or protocol to support network operations or provide liquidity, in exchange for rewards. The term APR stands for Annual Percentage Rate, which represents the yearly rate of return you can expect from your staked assets.
When Gate offers an 8.88% APR on USD1 staking, this means that if you stake 10,000 USD1 for one year, you would earn approximately 888 USD1 in rewards, assuming the rate remains constant. This is significantly higher than traditional savings accounts in most countries, where interest rates often hover around 1-3% or even lower.
How the USD1 Staking Program Works on Gate
The USD1 staking program on Gate operates through a sophisticated yet user-friendly mechanism. Users simply need to hold USD1 in their spot account and activate the staking feature to begin earning rewards. The platform takes hourly snapshots of your USD1 balance, calculating your average daily holding to determine your reward eligibility.
The reward calculation follows a simple formula: Daily earnings equal your average holding multiplied by the APR divided by 365 days. This means your rewards accrue daily, providing a steady stream of passive income. The system captures 24 snapshots per day, ensuring accurate tracking of your holdings even if you trade or move funds throughout the day.
One of the most attractive features of this program is its flexibility. Unlike traditional fixed deposits or some crypto staking programs that lock your funds for specific periods, Gate USD1 staking allows you to maintain full liquidity. You can trade, withdraw, or use your USD1 assets at any time while still earning staking rewards on your average daily balance.
The 8.88% APR Advantage
The 8.88% APR offered by Gate for USD1 staking is particularly noteworthy when compared to other investment options. In the current global economic environment where traditional banks offer minimal interest rates, an 8.88% return represents a substantial opportunity for wealth preservation and growth.
This rate is dynamic and may adjust based on various factors including platform reward budgets and total USD1 holdings across the platform. However, Gate has consistently maintained competitive rates for USD1 staking, making it an attractive option for both conservative investors seeking stability and aggressive traders looking to maximize returns on their idle funds.
Benefits for Different Types of Users
For long-term investors, the USD1 staking program offers a way to preserve purchasing power while earning meaningful returns. Instead of holding fiat currency in a bank account where inflation erodes value, investors can convert to USD1 and earn 8.88% annually, potentially outpacing inflation and building real wealth over time.
Active traders benefit from the ability to keep their trading capital in USD1 while waiting for optimal entry points in volatile markets. Rather than holding volatile assets during uncertain periods, traders can park their funds in USD1, earn staking rewards, and maintain readiness to deploy capital when opportunities arise.
For newcomers to cryptocurrency, USD1 staking provides an excellent entry point into the world of decentralized finance. The stable nature of USD1 eliminates price volatility concerns, while the staking mechanism introduces users to yield-generating opportunities in the crypto space without requiring complex technical knowledge.
Risk Considerations and Safety Measures
While the USD1 staking program offers attractive returns, users should understand the associated risks. Stablecoins, despite their name, are not entirely risk-free. Potential risks include smart contract vulnerabilities, regulatory changes, and platform-specific risks. Gate addresses these concerns through robust security measures, regular audits, and transparent communication about program terms.
The platform provides clear warnings that displayed APR rates are estimates and not guaranteed returns. Actual rewards may vary based on market conditions, platform policies, and other factors. Users should also be aware that cryptocurrency investments are subject to market volatility and policy changes that can affect returns.
Complementary Opportunities on Gate
Beyond the basic USD1 staking program, Gate offers additional ways to maximize returns on stablecoin holdings. The platform supports GUSD minting using USD1, where users can stake USDT, USDC, or USD1 to mint GUSD and earn additional yields. This creates opportunities for stacking multiple yield streams simultaneously.
The Launchpool feature allows users to stake various assets including stablecoins to earn new token airdrops, providing exposure to emerging projects while maintaining principal in stable assets. These complementary programs enhance the overall value proposition of holding and staking USD1 on the platform.
Strategic Implementation for Maximum Benefit
To maximize benefits from the USD1 staking program, users should consider several strategies. Maintaining consistent USD1 balances in their spot account ensures continuous reward accrual. Users should regularly check their staking activation status and understand the snapshot timing to optimize their holdings.
For those with larger portfolios, combining USD1 staking with other Gate products like GUSD minting and Launchpool participation can create a diversified yield-generating portfolio. This approach spreads risk across multiple mechanisms while maximizing overall returns.
The Gate Platform Advantage
Gate has established itself as a leading cryptocurrency exchange with a strong reputation for security, innovation, and user-centric services. The platform consistently offers competitive staking rates and develops new products to meet evolving user needs. The USD1 staking program exemplifies this commitment to providing value-added services beyond basic trading functionality.
The platform user-friendly interface makes staking accessible to users of all experience levels. Clear documentation, responsive customer support, and transparent reward calculations build trust and confidence in the program.
Future Outlook and Sustainability
The sustainability of 8.88% APR rates depends on various market factors including platform revenue, user participation, and broader cryptocurrency market conditions. Gate adjusts rates based on these factors to ensure program viability while remaining competitive.
As the cryptocurrency ecosystem continues to mature, stablecoin staking programs like this one are likely to become increasingly important bridges between traditional finance and decentralized finance. They offer the stability that institutional and retail investors demand while providing the accessibility and efficiency of blockchain technology.
The USD1 Stake and Earn 8.88% APR program on Gate represents a compelling opportunity for anyone looking to generate passive income from their cryptocurrency holdings. By combining the stability of a dollar-pegged asset with competitive returns, the program serves diverse user needs from conservative wealth preservation to active trading capital management.
The flexibility to trade and withdraw funds while earning rewards, combined with Gate reputation and security measures, makes this program an attractive option in the current market environment. As with any investment opportunity, users should conduct their own research, understand the risks involved, and consider their personal financial situation before participating.
For those ready to explore this opportunity, activating USD1 staking on Gate requires just a few simple steps, after which rewards begin accruing automatically. Whether you are building long-term wealth, managing trading capital, or simply exploring cryptocurrency yield opportunities, the USD1 staking program deserves serious consideration as part of a diversified digital asset strategy.
repost-content-media
  • Reward
  • 1
  • Repost
  • Share
HighAmbition:
To The Moon 🌕
#BernsteinSaysMemoryBullMarketToLastUntil2027
BERNSTEIN: THE GLOBAL MEMORY BULL MARKET COULD EXTEND THROUGH 2027 – WHY THE AI REVOLUTION MAY BE CREATING A NEW ERA FOR SEMICONDUCTORS
The global semiconductor industry is undergoing one of the most important transformations in its history. According to Bernstein's latest Monthly Memory Industry Report, the current memory bull market is not approaching its end. Instead, it is evolving into a healthier, more balanced, and more sustainable growth cycle that could continue through 2027.
While the extraordinary price surge witnessed during the early
HighAmbition
#BernsteinSaysMemoryBullMarketToLastUntil2027
BERNSTEIN: THE GLOBAL MEMORY BULL MARKET COULD EXTEND THROUGH 2027 – WHY THE AI REVOLUTION MAY BE CREATING A NEW ERA FOR SEMICONDUCTORS
The global semiconductor industry is undergoing one of the most important transformations in its history. According to Bernstein's latest Monthly Memory Industry Report, the current memory bull market is not approaching its end. Instead, it is evolving into a healthier, more balanced, and more sustainable growth cycle that could continue through 2027.
While the extraordinary price surge witnessed during the early stages of the recovery is expected to moderate, the structural foundations supporting the industry have become considerably stronger than in previous memory cycles.
Unlike earlier cycles that depended largely on smartphone upgrades, PC shipments, and short-lived consumer demand, today's memory market is increasingly powered by Artificial Intelligence, hyperscale cloud computing, enterprise digital transformation, advanced data centers, and high-performance computing. These long-term demand drivers are reshaping the semiconductor industry and creating a fundamentally different outlook for memory manufacturers.
━━━━━━━━━━━━━━━━━━━━━━
📊 Current Market Overview
Bernstein continues to maintain a constructive view on the memory industry.
✅ The memory cycle remains firmly bullish.
✅ Growth is becoming healthier and more sustainable rather than purely price-driven.
✅ Artificial Intelligence has replaced traditional consumer electronics as the industry's primary growth engine.
✅ Cloud infrastructure investment continues accelerating worldwide.
✅ Enterprise digital transformation remains a powerful long-term demand catalyst.
✅ Supply discipline among manufacturers continues supporting healthier pricing.
Rather than signaling weakness, the expected moderation in quarterly price increases reflects a transition from rapid recovery into a more mature expansion phase.
━━━━━━━━━━━━━━━━━━━━━━
🔥 DRAM Market Continues Delivering Exceptional Performance
DRAM has remained the strongest-performing segment within the memory industry.
During Q2:
📈 Overall DRAM prices increased approximately 74% quarter-over-quarter.
📈 Server DRAM prices climbed more than 60%, supported by explosive demand from AI servers and hyperscale cloud providers.
📈 Mobile DRAM prices surged nearly 80%, reflecting increasing memory requirements in flagship smartphones equipped with on-device AI capabilities.
Bernstein expects DRAM price growth to moderate to roughly 13%–18% during Q3. This slowdown should not be interpreted as weakening demand. Instead, it indicates that pricing is normalizing after an exceptionally strong recovery while the industry's underlying fundamentals remain healthy.
━━━━━━━━━━━━━━━━━━━━━━
💾 NAND Flash Market Shows Improving Fundamentals
Although NAND continues to exhibit mixed pricing dynamics, several important trends remain highly encouraging.
• Wafer pricing has begun to soften as inventories normalize.
• Mobile storage contract prices continue trending upward.
• Enterprise SSD contract prices have risen nearly 60%, reflecting robust demand from AI infrastructure, enterprise storage, and cloud computing.
As AI models become larger and enterprise workloads expand, demand for high-capacity storage solutions is expected to remain resilient.
━━━━━━━━━━━━━━━━━━━━━━
🤖 Artificial Intelligence Is Reshaping The Entire Memory Industry
Artificial Intelligence is now the single most important growth engine for memory manufacturers.
Training large language models, operating AI inference systems, autonomous applications, robotics, scientific computing, and generative AI platforms all require enormous quantities of high-speed DRAM and NAND memory.
Every new AI server contains significantly more memory than traditional enterprise servers. As governments, technology giants, and cloud providers continue investing billions of dollars into AI infrastructure, demand for advanced memory solutions continues expanding across virtually every major technology sector.
This represents a structural transformation rather than a temporary technology trend.
━━━━━━━━━━━━━━━━━━━━━━
☁️ Cloud Computing And Enterprise Investment Continue Accelerating
Hyperscale cloud providers remain among the largest purchasers of advanced memory products.
Long-term procurement agreements improve revenue visibility for manufacturers while reducing earnings volatility.
At the same time, enterprises worldwide continue modernizing their IT infrastructure through:
• AI deployment
• Digital transformation
• Data analytics
• Cybersecurity
• Cloud migration
These investments create recurring demand for advanced memory solutions over many years.
━━━━━━━━━━━━━━━━━━━━━━
⚖️ Supply Discipline Creates A Healthier Market
One of the biggest differences between today's cycle and previous memory booms is disciplined production management.
Leading manufacturers have become far more cautious about expanding capacity too aggressively.
Balanced supply reduces oversupply risks, supports stronger pricing, improves profitability, and lowers the probability of severe boom-and-bust cycles that historically affected the industry.
━━━━━━━━━━━━━━━━━━━━━━
🌍 The Memory Industry Is Undergoing A Structural Transformation
Memory demand is no longer dependent solely on consumer electronics.
Instead, growth increasingly comes from multiple high-value industries:
• Artificial Intelligence
• Cloud Computing
• Enterprise Servers
• High-Performance Computing
• Advanced Data Centers
• Autonomous Systems
• Edge Computing
• Scientific Research
This diversified demand base creates stronger long-term resilience.
━━━━━━━━━━━━━━━━━━━━━━
🏢 Bernstein's View On Major Companies
Bernstein maintains Positive Ratings on:
⭐ Samsung Electronics
⭐ SK Hynix
⭐ Micron Technology
⭐ SanDisk
The firm remains comparatively cautious on Kioxia, citing a less favorable outlook relative to its peers.
━━━━━━━━━━━━━━━━━━━━━━
📈 Major Growth Opportunities
✔ Continued AI infrastructure expansion.
✔ Increasing hyperscale cloud investment.
✔ Enterprise storage upgrades.
✔ Higher memory content across modern devices.
✔ Strong demand for AI servers.
✔ Sustainable pricing supported by disciplined production.
✔ Long-term digital transformation worldwide.
━━━━━━━━━━━━━━━━━━━━━━
⚠️ Risks Investors Should Monitor
No bull market moves in a perfectly straight line.
Potential risks include:
• Weak consumer electronics demand.
• Slower global economic growth.
• Supply-demand imbalances.
• Reduced enterprise technology spending.
• Geopolitical uncertainty.
• Increased manufacturing competition.
• Unexpected capacity expansion.
Monitoring these variables remains essential for evaluating future market conditions.
━━━━━━━━━━━━━━━━━━━━━━
💡 Investor Perspective
Investors should pay close attention to:
📊 AI infrastructure spending.
📊 Hyperscale cloud capital expenditure.
📊 DRAM pricing trends.
📊 NAND contract pricing.
📊 Inventory levels.
📊 Supply discipline.
📊 Enterprise data center expansion.
📊 Earnings guidance from leading semiconductor companies.
Together, these indicators will likely determine whether the memory supercycle continues through 2027.
━━━━━━━━━━━━━━━━━━━━━━
🏁 Final Thoughts
Bernstein's latest report suggests the memory semiconductor industry is entering a new era rather than approaching the end of its bull market. Artificial Intelligence has fundamentally changed how memory is consumed, shifting demand from traditional consumer devices toward mission-critical AI infrastructure, cloud platforms, enterprise computing, and next-generation data centers.
Although quarterly price increases are expected to become more moderate following the exceptional gains recorded during Q2, the long-term structural drivers remain firmly intact. If AI investment, cloud expansion, and enterprise digital transformation continue at their current pace, the memory industry could remain one of the strongest-performing segments of the global technology sector through 2027.
For long-term investors, the evolution of the memory market illustrates how AI is transforming not only software, but also the foundational hardware powering the future digital economy.
@Gate_Square
repost-content-media
  • Reward
  • 1
  • Repost
  • Share
HighAmbition:
2026 GOGOGO 👊
#AnthropicSecondaryValuationHits1.2Trillion
ANTHROPIC'S AI MOMENT: $1.2 TRILLION SECONDARY VALUATION & CUSTOM AI CHIP STRATEGY
Artificial intelligence continues to reshape the global technology landscape, and the latest developments surrounding Anthropic have become one of the biggest talking points in the AI industry. According to market reports, Anthropic's secondary market valuation has climbed to approximately $1.2 trillion, highlighting exceptionally strong investor demand for shares of one of the world's leading AI companies. At the same time, reports indicate that Anthropic is explorin
HighAmbition
#AnthropicSecondaryValuationHits1.2Trillion
ANTHROPIC'S AI MOMENT: $1.2 TRILLION SECONDARY VALUATION & CUSTOM AI CHIP STRATEGY
Artificial intelligence continues to reshape the global technology landscape, and the latest developments surrounding Anthropic have become one of the biggest talking points in the AI industry. According to market reports, Anthropic's secondary market valuation has climbed to approximately $1.2 trillion, highlighting exceptionally strong investor demand for shares of one of the world's leading AI companies. At the same time, reports indicate that Anthropic is exploring a partnership with Samsung Electronics to develop custom AI accelerator chips, reflecting a broader industry trend toward building specialized AI infrastructure.
It is important to understand that a secondary market valuation is different from an official valuation established during a primary funding round. In secondary transactions, existing shareholders sell their shares to new investors rather than the company raising fresh capital.
Because of this, secondary pricing reflects investor demand, market confidence, and future expectations instead of an official fundraising valuation. Even so, secondary market activity is often viewed as an important indicator of how private investors assess a company's long-term growth potential.
The reported $1.2 trillion valuation demonstrates how powerful the AI investment narrative has become. During the past few years, artificial intelligence has evolved from an emerging technology into a core business solution used across software development, healthcare, financial services, cybersecurity, education, scientific research, manufacturing, enterprise automation, customer service, logistics, and digital productivity. As adoption continues expanding worldwide, investors are placing increasing value on companies capable of developing advanced AI models and scalable infrastructure.
Anthropic has established itself as one of the leading organizations in the global AI race through its focus on advanced language models, enterprise AI solutions, and responsible AI development. As businesses increasingly seek intelligent systems capable of improving efficiency, reducing operational costs, and supporting decision-making, companies with strong AI capabilities continue attracting significant institutional interest.
One of the most interesting developments is Anthropic's reported exploration of custom AI accelerator chips with Samsung Electronics. While discussions are believed to remain at an early stage, the potential collaboration reflects an industry-wide movement toward greater hardware optimization. Rather than relying entirely on general-purpose AI processors, many leading AI developers are evaluating specialized silicon designed specifically for their own models and workloads.
Reports suggest Samsung's advanced 2-nanometer manufacturing technology could play a key role in this initiative. Compared with earlier process generations, 2nm technology is expected to deliver approximately 45% higher transistor density and around 25% better power efficiency, enabling more computing performance while reducing energy consumption. As AI models continue growing in complexity, improvements in efficiency become increasingly valuable for long-term scalability.
The AI semiconductor industry itself has become one of the fastest-growing technology segments in the world. Massive investments are flowing into advanced manufacturing, cloud computing, networking infrastructure, high-bandwidth memory, storage technology, AI software, and data centers. Success in artificial intelligence is no longer determined only by model quality but also by the ability to build efficient infrastructure capable of supporting billions of AI requests every day.
Today, Nvidia remains the dominant supplier of AI accelerators with an estimated market share of roughly 80%. While its products continue leading the market, many AI developers are exploring additional hardware strategies to diversify supply chains and optimize long-term computing costs. Industry analysts believe specialized AI chips may improve efficiency for selected workloads while supporting greater flexibility across large-scale AI deployments.
Custom silicon has become an increasingly important strategic objective throughout the industry. Unlike general-purpose processors, AI accelerators can be designed specifically for transformer-based models, optimizing tensor operations, memory access, and data movement. Depending on workload characteristics, industry discussions often suggest specialized hardware may deliver significantly better performance-per-watt while reducing operating costs over time.
The broader AI ecosystem continues expanding at an extraordinary pace. Global technology companies are investing billions of dollars into semiconductor fabrication plants, AI cloud infrastructure, enterprise software platforms, networking equipment, cybersecurity, robotics, storage systems, and advanced memory solutions. These complementary industries form the foundation supporting the next generation of artificial intelligence applications.
Investor enthusiasm surrounding AI has also created significant opportunities across related sectors. Semiconductor manufacturers, memory producers, cloud computing providers, networking companies, enterprise software developers, cybersecurity firms, and data infrastructure businesses all stand to benefit as AI adoption accelerates. Every improvement in AI capabilities increases demand for computing hardware, storage capacity, networking bandwidth, and efficient power management.
However, premium valuations naturally come with higher expectations. Investors expect continued technological innovation, expanding enterprise adoption, sustainable revenue growth, strong commercial execution, and responsible AI deployment. High valuations are ultimately supported by long-term business performance rather than market excitement alone.
Like every rapidly growing technology sector, artificial intelligence also faces challenges. Competition continues intensifying as leading companies invest heavily in research, infrastructure, and engineering talent.
Regulatory developments, technological breakthroughs, changing macroeconomic conditions, and shifts in investor sentiment may all influence future valuations. Private market pricing can fluctuate considerably and should therefore be viewed as an indicator of market expectations rather than a guarantee of future success.
From an investment perspective, the reported $1.2 trillion secondary valuation highlights the extraordinary confidence many investors currently place in artificial intelligence. Whether future valuations continue rising will depend on continued innovation, successful commercialization, enterprise adoption, infrastructure expansion, and the ability to generate sustainable long-term value.
My Observation
In my opinion, the latest developments surrounding Anthropic demonstrate that artificial intelligence has entered a new phase where software and hardware innovation are becoming equally important. Building powerful AI models remains essential, but controlling computing infrastructure, improving efficiency, and scaling enterprise deployment may become major competitive advantages over the coming years. Companies capable of combining advanced AI research with strong infrastructure execution could be well positioned as global AI adoption continues expanding.
The reported secondary valuation and the exploration of custom AI chips together illustrate the direction in which the industry is moving. Investors are increasingly focusing not only on model capabilities but also on computing efficiency, semiconductor innovation, cloud infrastructure, enterprise adoption, and sustainable business execution.
Final Thoughts
Artificial intelligence remains one of the defining investment and technology themes of this decade. The reported $1.2 trillion secondary valuation reflects strong investor confidence, while the potential collaboration with Samsung highlights the growing importance of customized AI infrastructure. Regardless of future market fluctuations, innovation, responsible development, commercial execution, and expanding real-world adoption will continue determining long-term success. As AI evolves across industries worldwide, developments involving leading companies like Anthropic will remain closely watched by investors, businesses, developers, and technology enthusiasts.
@Gate_Square
repost-content-media
  • Reward
  • 1
  • Repost
  • Share
HighAmbition:
Get on board now! 🚗
#WorldCupChampionPrediction
FIFA World Cup 2026 Semifinals Preview: The Final Four Battle for Glory
The 2026 FIFA World Cup has reached its most thrilling stage as four football powerhouses prepare to clash in the semifinals. After weeks of intense competition across North America, the tournament has narrowed down to France, Spain, Argentina, and England as the final contenders for the coveted trophy.
The Semifinal Matchups
The semifinals will feature two mouthwatering encounters that promise high drama and world-class football. France will face Spain in what many are calling the match of the
HighAmbition
#WorldCupChampionPrediction
FIFA World Cup 2026 Semifinals Preview: The Final Four Battle for Glory
The 2026 FIFA World Cup has reached its most thrilling stage as four football powerhouses prepare to clash in the semifinals. After weeks of intense competition across North America, the tournament has narrowed down to France, Spain, Argentina, and England as the final contenders for the coveted trophy.
The Semifinal Matchups
The semifinals will feature two mouthwatering encounters that promise high drama and world-class football. France will face Spain in what many are calling the match of the tournament, while defending champions Argentina will take on England in a rematch of the 1986 and 1998 World Cup classics. These matchups bring together the finest talents in world football, with superstars like Kylian Mbappe, Lamine Yamal, Lionel Messi, and Jude Bellingham all vying for a place in the final.
France enters this stage after a commanding 2-0 victory over Morocco in the quarterfinals. The 2018 champions have looked formidable throughout the tournament, with their blend of experience and youthful energy proving difficult for opponents to handle. Didier Deschamps side has shown remarkable consistency and tactical flexibility.
Spain secured their semifinal berth with a hard-fought victory over Belgium. Luis de la Fuente team has been one of the most entertaining sides to watch, combining their traditional possession-based football with a newfound directness that has caught opponents off guard. The emergence of Lamine Yamal as a genuine world-class talent has been one of the stories of the tournament.
Argentina advanced past Switzerland after a tense encounter that went to extra time. Lionel Messi continues to defy age and expectations, leading his team with the same determination that carried them to glory in 2022. The defending champions have shown resilience and character in navigating difficult moments.
England completed the semifinal lineup with a dramatic 2-1 extra-time victory over Norway. Jude Bellingham was the hero, scoring both goals in a performance that underlined his status as one of the best midfielders in the world. Gareth Southgate side has grown into the tournament, overcoming early skepticism about their credentials.
Polymarket Predictions and Market Analysis
According to Polymarket data, France leads the championship odds at 33 percent, making them the clear favorites among the remaining teams. Argentina follows at 20 percent, with Spain close behind at 19 percent. England sits at 16 percent, while Norway who have been eliminated had 6 percent before their quarterfinal exit.
These odds reflect not just current form but also historical pedigree and squad depth. France status as favorites is understandable given their 2018 triumph and the depth of talent at Deschamps disposal. However, the relatively close percentages for the other three teams suggest a genuinely open competition.
The market has shown significant movement throughout the knockout stages. France odds have strengthened as they have progressed, while England have seen their percentage rise following their dramatic quarterfinal victory. Argentina have maintained steady support from bettors who believe in Messi ability to deliver one more magical tournament.
My Analysis and Predictions
Looking at the semifinal matchups, I believe France versus Spain will be an exceptionally tight contest. Spain possession game against France counterattacking threat creates a fascinating tactical battle. While France are favorites in the market, Spain youthful exuberance and technical quality make them dangerous opponents. I lean slightly toward France advancing due to their tournament experience and defensive solidity, but this could easily go either way.
The Argentina versus England matchup is equally compelling. Argentina have the advantage of Messi genius and their status as defending champions, but England have shown tremendous character and have a midfield engine in Bellingham that can dominate games. England victory over Norway demonstrated their ability to win ugly when necessary, a crucial quality in knockout football.
My prediction for the final is France versus Argentina, a rematch of the 2022 final. France superior squad depth and tactical versatility should see them past Spain, while Argentina experience and Messi presence give them the edge against England. A France versus Argentina final would be fitting for this tournament, pitting the two most recent champions against each other.
However, football is unpredictable, and England or Spain could easily upset these predictions. England have shown they can win tight matches, and Spain attacking flair could overwhelm any defense on their day. The beauty of this World Cup has been its unpredictability, and the semifinals promise more of the same.
The 2026 World Cup has already delivered memorable moments, and these semifinals represent the culmination of years of preparation for these four nations. Regardless of who advances, football fans are guaranteed two matches of the highest quality as the road to the final continues.
@Gate_Square
repost-content-media
  • Reward
  • 1
  • Repost
  • Share
HighAmbition:
Get on board now! 🚗
#EmperyDigitalMovesFromBTCtoAI
Empery Digital Sells Half of Its Bitcoin Holdings to Invest in AI Data Centers; Shares Jump Over 4 Percent
A Major Trend Shifting from Crypto to AI
Empery Digital, formerly known as Volcon, has made a significant decision. The company sold half of its Bitcoin holdings, specifically 1,400 BTC, at an average price of 62,200 dollars, raising 87.1 million dollars. This money will now be invested in AI data centers. Following this news, the company's shares surged over 4 percent, indicating investor approval of this move.
This is not a small piece of news. It signals
BTC0.38%
HighAmbition
#EmperyDigitalMovesFromBTCtoAI
Empery Digital Sells Half of Its Bitcoin Holdings to Invest in AI Data Centers; Shares Jump Over 4 Percent
A Major Trend Shifting from Crypto to AI
Empery Digital, formerly known as Volcon, has made a significant decision. The company sold half of its Bitcoin holdings, specifically 1,400 BTC, at an average price of 62,200 dollars, raising 87.1 million dollars. This money will now be invested in AI data centers. Following this news, the company's shares surged over 4 percent, indicating investor approval of this move.
This is not a small piece of news. It signals a major transformation happening in the cryptocurrency world. Empery Digital has invested 65 million dollars in an AI data center project being built in the Midwest. This facility will be 150 MW, and Empery Digital will hold a 25 percent stake in it. Hunt Properties is also a partner in this project.
Bitcoin Price Still Under Pressure
Currently, the Bitcoin market is under significant pressure. The price is fluctuating between 62,000 and 64,000 dollars. The Fear and Greed Index is between 22 and 24, which falls into the extreme fear category. ETFs have seen net outflows of 8,790 million dollars, indicating institutional investor caution.
BTC touched a recent low near 58,000 dollars but is now recovering toward 64,000 dollars. However, this recovery is due to short covering rather than fresh buying pressure. The market remains in a fragile condition.
What Impact Will Empery Digital's Bitcoin Sale Have on the Market
When a major company sells its Bitcoin holdings, pressure increases in the market. Empery Digital sold 1,400 BTC and made it clear that they want to move away from the Bitcoin treasury strategy toward AI infrastructure. The company has also shut down its Bitcoin treasury dashboard.
This reveals two things. First, institutional investors are now more interested in AI than crypto. Second, demand for Bitcoin could decrease if more large companies follow the same strategy. However, in this case, the sell pressure of 1,400 BTC is not that significant compared to Bitcoin's overall market.
What Traders Are Thinking
Opinions on X are mixed. Some say this is a bearish signal that companies are leaving crypto for AI. However, some traders view this as a natural transition. Investment in AI data centers provides stable recurring revenue, which is better than Bitcoin's volatility.
Whales have accumulated over 270,000 BTC in the last two weeks, while retail investors are still in fear. This shows that smart money still believes in Bitcoin and is buying on dips.
Technical Analysis and Key Levels
The support level is currently between 62,000 and 62,500 dollars. If this level breaks, the next support is at 58,000 dollars. Resistance is at 66,000 dollars, and a break above this could start bullish momentum.
Funding rates are negative or soft, indicating that traders are cautious and not holding highly leveraged positions. This is good because it reduces the risk of liquidation.
What Trading Strategy Should Be Followed
For short-term traders, a wait and watch strategy is better for now. The 62,000 dollar support needs to hold for bullish confirmation. If this level breaks, further downside to 58,000 dollars is possible.
For long-term investors, this could be a good accumulation opportunity. Whale buying activity shows that major players are still bullish on Bitcoin. However, position sizing should be careful because the market is still uncertain.
If the 66,000 dollar resistance breaks and ETF inflows resume, the next target could reach 70,000 dollars. But for this, macro conditions need to be favorable.
What Is the Future Outlook
Empery Digital's move could signal a trend. More companies that were following the Bitcoin treasury strategy might also shift to AI infrastructure. Demand for AI data centers is very high, and they provide stable returns.
But this does not mean Bitcoin is finished. Bitcoin still holds its place as digital gold. Institutional adoption is still continuing, but the pace might slow if macro conditions remain tight.
Traders should monitor ETF flows, the Fear and Greed Index, and whale activity. July is historically a good month for Bitcoin, but this time there are macro headwinds that could affect price action.
Conclusion
Empery Digital sold its Bitcoin holdings and invested in AI data centers, and the company's shares surged over 4 percent. This is a strategic pivot showing that companies now prefer stable revenue streams over volatile crypto holdings.
Bitcoin's market is still under pressure, but recovery is possible due to whale accumulation and potential ETF inflows. Traders should remain cautious and focus on key levels. In the short term, volatility will persist, but in the long term, Bitcoin's fundamentals remain strong.
Empery Digital's move is an example of how traditional companies are moving from crypto toward AI infrastructure. This trend could be seen with more companies in the coming days.
@Gate_Square
repost-content-media
  • Reward
  • 1
  • Repost
  • Share
HighAmbition:
To The Moon 🌕
#RobinhoodChainETH
Tom Lee, Managing Partner and Head of Research at Fundstrat, made a significant observation about Robinhood's blockchain initiative and its implications for Ethereum. His statement essentially highlights that as Robinhood Chain gains popularity, it further cements ETH's position as the primary on-chain money in the blockchain economy.
The Core Concept:
Robinhood Chain uses ETH as its native gas token. This means every transaction on the Robinhood Chain requires ETH to execute. When a major traditional finance platform like Robinhood chooses ETH over creating its own token,
ETH0.80%
HOOD-6.57%
HighAmbition
#RobinhoodChainETH
Tom Lee, Managing Partner and Head of Research at Fundstrat, made a significant observation about Robinhood's blockchain initiative and its implications for Ethereum. His statement essentially highlights that as Robinhood Chain gains popularity, it further cements ETH's position as the primary on-chain money in the blockchain economy.
The Core Concept:
Robinhood Chain uses ETH as its native gas token. This means every transaction on the Robinhood Chain requires ETH to execute. When a major traditional finance platform like Robinhood chooses ETH over creating its own token, it validates Ethereum's dominance as the settlement layer for decentralized finance. This is not merely about price speculation; it is about ETH functioning as actual money within blockchain ecosystems.
Current ETH Market Analysis:
As of early July 2026, Ethereum is trading around $1,770, having recovered from multi-month lows near $1,570. The market structure shows ETH in a consolidation phase with mixed signals across technical indicators.
Key Support and Resistance Levels:
Support levels for ETH are currently identified at $1,718 (20-day EMA), $1,600 (psychological level), and $1,570 (recent lows). The 20-day EMA at $1,718 is particularly critical as it represents short-term support. A hold above this level could help ETH retest recent highs. Resistance levels are positioned at $1,840, $1,900, and the psychological $2,000 mark. The 50-day moving average sits at approximately $1,770, while the 200-day moving average is higher at $2,231, indicating ETH is currently trading below its long-term average which is typically considered a bearish signal.
RSI Analysis:
The Relative Strength Index for ETH is currently around 52-56, placing it in neutral territory. This is neither overbought nor oversold, suggesting the market is in a balance phase rather than showing extreme momentum in either direction. An RSI reading in this range indicates there is room for movement in both directions without immediate exhaustion concerns.
What Traders Are Thinking:
Market participants are currently weighing several factors. On the bullish side, ETH has shown resilience by holding above key support levels and maintaining bullish consolidation within the daily TBO Cloud. The on-balance volume indicator looks constructive, suggesting underlying buying interest. Additionally, institutional adoption continues through staking, Layer-2 growth, and tokenized asset activity.
On the bearish side, active addresses have fallen to fresh lows around 420,000, representing a decline of approximately 46%. This weakening engagement is a concern for near-term price momentum. The broader macro environment with Fed policy uncertainty also creates headwinds for risk assets including ETH.
Price Forecast and Trading Strategy:
Analysts project ETH's 2026 price range between $1,718 and $2,242 based on current EMA structures. The immediate outlook depends on whether ETH can hold above the $1,718 support level. A successful defense of this level could see ETH retest $1,840 resistance and potentially move toward $1,900-$2,000.
For traders, the current setup suggests a cautious approach. The neutral RSI and mixed technical signals indicate waiting for clearer direction rather than aggressive positioning. A break above $1,840 with volume would confirm bullish continuation, while a breakdown below $1,718 would open the door for a retest of $1,600 or lower.
Next Steps and Planning:
Traders should monitor ETH's behavior around the $1,718-$1,770 zone closely. This range represents the battleground between bulls and bears. If ETH can reclaim and hold above the 200-day moving average at $2,231, it would signal a significant trend reversal. Until then, the strategy favors range trading with tight risk management, watching for ETF flows, staking demand, and Layer-2 transaction growth as leading indicators beyond pure price action.
The Robinhood Chain development supports the longer-term thesis that ETH's utility as on-chain money will drive sustained demand, but near-term price action remains dependent on broader market conditions and technical levels.
@Gate_Square
repost-content-media
  • Reward
  • 1
  • Repost
  • Share
HighAmbition:
Get on board now! 🚗
Last 12 hours! Take home $10,000 CFD voucher cards, Gate World Cup gift boxes, and more!
Tap hard to jump straight to the giveaway venue 👉 https://www.gate.com/activities/pointprize?now_period=20
Three steps to secure your prizes:
✅ Stay active in the plaza (posting/liking/sharing)
✅ Click the posting page 【+】-【Activity Center】-【Community Giveaway】
✅ Leave the rest to luck—new and existing users will never be left out!
📢 Meet in the comments section: Share your winning screenshot! Let’s see who has the best luck!
#BTC #ETH #ZEC
BTC0.37%
ETH0.80%
ZEC-0.71%
HighAmbition
Last 12 hours! Take home $10,000 CFD voucher cards, Gate World Cup gift boxes, and more!
Tap hard to jump straight to the giveaway venue 👉 https://www.gate.com/activities/pointprize?now_period=20
Three steps to secure your prizes:
✅ Stay active in the plaza (posting/liking/sharing)
✅ Click the posting page 【+】-【Activity Center】-【Community Giveaway】
✅ Leave the rest to luck—new and existing users will never be left out!
📢 Meet in the comments section: Share your winning screenshot! Let’s see who has the best luck!
#BTC #ETH #ZEC
repost-content-media
  • Reward
  • 1
  • Repost
  • Share
HighAmbition:
Get on board now! 🚗
#WorldCupChampionPrediction
#FranceVsSpain
My Semifinal Prediction
The FIFA World Cup 2026 semifinal between France and Spain promises to be one of the most exciting matches of the tournament. Both teams have shown outstanding quality throughout the competition and fully deserve their place in the final four.
My Prediction: France to Win
In my opinion, France has a slight edge heading into this match. Their balance between attack and defense, experience in major tournaments, and ability to perform under pressure could make the difference in a tight semifinal. Spain has controlled possession
HighAmbition
#WorldCupChampionPrediction
#FranceVsSpain
My Semifinal Prediction
The FIFA World Cup 2026 semifinal between France and Spain promises to be one of the most exciting matches of the tournament. Both teams have shown outstanding quality throughout the competition and fully deserve their place in the final four.
My Prediction: France to Win
In my opinion, France has a slight edge heading into this match. Their balance between attack and defense, experience in major tournaments, and ability to perform under pressure could make the difference in a tight semifinal. Spain has controlled possession brilliantly throughout the tournament, but France's pace on the counterattack and clinical finishing may prove decisive.
I expect a competitive match with very few clear chances. Spain will likely dominate possession, while France may focus on quick transitions and efficient finishing. If France remains disciplined defensively and converts its opportunities, I believe they can secure a place in the World Cup Final.
Predicted Score: France 2–1 Spain
Of course, football is unpredictable, and either team has the quality to win. This is simply my personal opinion based on each team's performances so far, not financial or betting advice.
Who do you think reaches the Final—France or Spain? Share your prediction below! ⚽🏆
@Gate_Square
repost-content-media
  • Reward
  • 1
  • Repost
  • Share
HighAmbition:
2026 GOGOGO 👊
#XAUT
Tether Gold XAUT is currently trading at approximately 4093 dollars which represents a significant position in the tokenized gold market. This price level reflects the underlying physical gold backing each token combined with current market sentiment and broader economic conditions affecting precious metals globally.
Why Gold and XAUT Have Declined Recently
The recent downward movement in XAUT from higher levels around 4350 dollars to the current 4093 dollars can be attributed to several interconnected factors. First the strengthening US dollar has created headwinds for dollar denominat
HighAmbition
#XAUT
Tether Gold XAUT is currently trading at approximately 4093 dollars which represents a significant position in the tokenized gold market. This price level reflects the underlying physical gold backing each token combined with current market sentiment and broader economic conditions affecting precious metals globally.
Why Gold and XAUT Have Declined Recently
The recent downward movement in XAUT from higher levels around 4350 dollars to the current 4093 dollars can be attributed to several interconnected factors. First the strengthening US dollar has created headwinds for dollar denominated gold prices as a stronger dollar makes gold more expensive for holders of other currencies. Second profit booking after the exceptional bull run that saw gold reach all time highs above 4500 dollars has naturally led to corrective phases. Third the Federal Reserve policy expectations have shifted with markets now pricing in fewer rate cuts than previously anticipated which reduces gold appeal as a non yielding asset. Additionally easing geopolitical tensions particularly around US Iran negotiations have reduced safe haven demand temporarily causing gold to retreat from risk premium levels.
When Will Bullish Sentiment Return
Bullish sentiment for XAUT is likely to reestablish under several conditions. The most critical factor will be Federal Reserve policy pivoting toward more accommodative monetary stance which typically supports gold prices. Any breakdown in US Iran negotiations or escalation of Middle East tensions would immediately restore safe haven demand. Furthermore sustained dollar weakness combined with continued central bank gold purchases particularly from emerging market nations will provide underlying support. Technical confirmation through reclaiming key moving averages will also signal sentiment shift from bearish to bullish.
Trader Psychology and Current Market Thinking
Professional traders are currently adopting a cautious approach toward XAUT and gold markets. Many are waiting for clearer directional signals before committing significant capital. Short term traders are focusing on range bound strategies between 4050 and 4200 dollars while longer term investors view current levels as accumulation opportunities. The consensus among experienced market participants suggests that while near term volatility persists the fundamental case for gold remains intact particularly given ongoing geopolitical uncertainties and inflation concerns.
Price Forecast and Targets
Based on technical analysis and market structure XAUT has several key price targets to monitor. In the bullish scenario if XAUT reclaims 4200 dollars as support the next target emerges near 4350 dollars with potential extension toward 4550 dollars representing previous highs. A sustained breakout above 4550 dollars could open path toward 4800 to 5000 dollars range. On the downside immediate support sits at 4050 dollars with critical support at 4000 dollars. A break below 4000 dollars would signal deeper correction potentially toward 3850 to 3900 dollars zone.
Trading Strategy Recommendations
For active traders current strategy should focus on range trading between established support and resistance levels until clear breakout occurs. Consider scaling into long positions near 4050 to 4080 dollars support zone with stops below 4000 dollars. For swing traders patience is advised waiting for either reclaim of 4200 dollars for long entry or breakdown below 4050 for short positioning. Risk management remains paramount given current volatility with position sizing reflecting the uncertain directional outlook.
Key Support and Resistance Levels
Critical resistance levels for XAUT include 4150 dollars as immediate hurdle followed by 4200 dollars as significant psychological and technical barrier. Above this 4350 dollars represents previous resistance turned potential support while 4550 dollars marks all time high zone. Support levels include 4080 dollars as immediate floor followed by 4050 dollars as key technical support. The 4000 dollars level represents critical line in sand where bullish structure would be seriously compromised if broken.
RSI Analysis
The Relative Strength Index for XAUT currently suggests oversold conditions on shorter timeframes indicating potential for bounce or consolidation. Daily RSI readings have moved from overbought territory above 70 during the rally to more neutral levels around 40 to 45 suggesting room for recovery before reaching extreme levels. However weekly RSI remains elevated from the extended bull run indicating that longer term correction potential still exists. Traders should watch for RSI divergence signals at key support levels which often precede price reversals.
Geopolitical Risk Premium
The ongoing US Iran tensions represent significant variable for XAUT price action. Historical precedent shows that major geopolitical conflicts typically drive oil prices substantially higher with Brent crude potentially moving from current levels toward 110 to 120 dollars per barrel if conflict escalates. Such oil price spikes create inflationary pressures that historically support gold prices as inflation hedge. However currency dynamics complicate this relationship as oil priced in dollars strengthens dollar demand which can offset some safe haven flows into gold.
Crypto Market Correlation
XAUT as tokenized gold maintains correlation with both physical gold markets and broader cryptocurrency sentiment. During periods of crypto market stress XAUT often benefits from flight to quality within digital asset ecosystem. However if major geopolitical conflict causes broad based risk off sentiment across all asset classes including cryptocurrencies XAUT could face temporary pressure as investors liquidate positions across portfolios to meet margin calls or raise cash. The key differentiation is that XAUT represents tangible asset backing unlike purely speculative crypto assets.
Oil Price Impact Analysis
Should US Iran war materialize oil prices are projected to surge significantly with estimates ranging from 90 dollars to over 120 dollars per barrel depending on conflict severity and duration. Such energy price inflation would have dual effect on XAUT creating both supportive inflation hedge demand and potentially restrictive dollar strength headwinds. Historical analysis of Middle East conflicts shows gold typically outperforms in six to twelve month period following conflict initiation as initial volatility subsides and inflationary impacts manifest.
Long Term Outlook
The long term outlook for XAUT remains constructive supported by structural factors including continued central bank gold accumulation de dollarization trends among emerging economies and ongoing geopolitical fragmentation. Price targets for 2026 year end range from conservative 4500 dollars to optimistic 5500 dollars depending on macroeconomic developments. The tokenized nature of XAUT provides additional utility through blockchain accessibility while maintaining direct exposure to physical gold price movements.
Risk Factors to Monitor
Key risks include Federal Reserve maintaining hawkish stance longer than anticipated resolution of US Iran tensions removing risk premium sustained dollar strength driven by safe haven flows outside gold and technical breakdown below 4000 dollars support triggering algorithmic selling. Additionally regulatory developments affecting tokenized assets could impact XAUT liquidity and accessibility though direct gold backing provides fundamental floor.
Conclusion
XAUT at 4093 dollars represents strategic entry point for investors with medium to long term horizon despite near term uncertainty. Current price action reflects healthy correction within broader bull market structure rather than trend reversal. Traders should maintain disciplined approach respecting key technical levels while monitoring geopolitical developments and Federal Reserve policy communications for directional catalysts. The combination of technical oversold conditions fundamental support factors and potential geopolitical escalation creates asymmetric opportunity favoring upside resolution.@Gate_Square
repost-content-media
  • Reward
  • 1
  • Repost
  • Share
HighAmbition:
2026 GOGOGO 👊
#MetalsMarketUpdate
Metals Market Analysis - July 2026
The precious metals market is currently experiencing significant volatility due to escalating geopolitical tensions between the United States and Iran.
Current Market Situation
Gold is trading around $4,128 per ounce as of early July 2026, having experienced considerable fluctuations in recent weeks. The market has been under pressure following President Trump's announcement that the US-Iran interim peace deal is over. Silver is trading near $60 per ounce, while platinum has reached approximately $1,973 per ounce.
The metals market is cu
HighAmbition
#MetalsMarketUpdate
Metals Market Analysis - July 2026
The precious metals market is currently experiencing significant volatility due to escalating geopolitical tensions between the United States and Iran.
Current Market Situation
Gold is trading around $4,128 per ounce as of early July 2026, having experienced considerable fluctuations in recent weeks. The market has been under pressure following President Trump's announcement that the US-Iran interim peace deal is over. Silver is trading near $60 per ounce, while platinum has reached approximately $1,973 per ounce.
The metals market is currently in a consolidation phase with mixed signals. While long-term fundamentals remain supportive for precious metals, short-term price action is heavily influenced by geopolitical developments and Federal Reserve policy expectations.
US-Iran Tensions Impact on Markets
The renewed military conflict between the United States and Iran has created a complex market reaction that differs from traditional safe-haven scenarios. When Iran launched attacks on US military infrastructure in Gulf states in early July 2026, following US strikes on Iranian targets, the immediate market response was an oil price surge rather than a blanket flight to safety assets.
Iran has reportedly struck 85 US sites in Bahrain and Kuwait, escalating tensions significantly. The Strait of Hormuz, through which approximately 20 percent of global oil supplies pass, remains a critical concern. Any disruption to this vital shipping lane could have far-reaching consequences for global energy markets and, by extension, inflation expectations.
The relationship between geopolitical stress and precious metals pricing has become more nuanced than the traditional rule of thumb suggests. Rising oil prices due to Middle East tensions are fueling inflation concerns, which paradoxically may lead to tighter monetary policy from the Federal Reserve. This hawkish shift in policy expectations is currently working against gold rather than supporting it.
Gold prices fell recently as oil prices surged and inflation concerns intensified. The market is pricing in the probability that the Federal Reserve may keep monetary policy tight for longer or even raise interest rates if inflation pressures mount due to higher energy costs.
Market Direction - Bull or Bear
The current market sentiment is mixed, with elements of both bullish and bearish factors at play.
Bullish factors include ongoing central bank buying of gold, structural supply deficits in platinum exceeding one million ounces annually, strong safe-haven appeal for long-term investors, and continued geopolitical uncertainty that supports precious metals as portfolio hedges.
Bearish factors include rising US Treasury yields, a stronger US dollar, concerns about Federal Reserve rate hikes, short-term investor selling in gold and silver, and profit-taking after the significant price appreciation seen in early 2026.
The market is currently neither fully bullish nor bearish but rather in a state of uncertainty as traders weigh these competing forces. Gold is defending the critical $4,000 support level, which represents an important psychological and technical barrier.
Three Metals Analysis and Trading Strategy
Gold Analysis
Current price is approximately $4,128 per ounce. Gold is facing a crucial test at the $4,000 support level. A decisive break below this level could trigger additional technical selling and increase short-term volatility. However, the broader long-term outlook for gold remains constructive.
Key support levels are located at $4,000 and $3,950. Key resistance levels are at $4,200 and $4,250. Traders are watching the $4,000 level closely as it represents both a technical and psychological threshold.
The forecast for gold suggests potential upside toward $4,300 to $4,500 per ounce if geopolitical tensions escalate further and the Federal Reserve adopts a more dovish stance. However, if the $4,000 support breaks, prices could retreat to $3,800 to $3,900 in the near term.
Trading strategy for gold involves buying on dips near the $4,000 to $4,050 support zone with stop losses below $3,950. Targets are set at $4,200 for the first resistance and $4,300 for extended moves. Risk management is essential given the high volatility environment.
Silver Analysis
Current price is approximately $60 per ounce. Silver has experienced significant volatility, testing the $60 level which represents key resistance. Silver is positioned for potential breakout on the back of renewable energy growth and industrial demand.
Key support levels for silver are at $55 and $50. Key resistance levels are at $65 and $70. The metal has shown resilience despite short-term selling pressure from some investors.
The forecast for silver suggests potential movement toward $65 to $70 per ounce if industrial demand remains strong and investment flows return. However, short-term downside risk exists toward $55 or even $50 if selling pressure continues.
Trading strategy for silver involves accumulating positions near $58 to $59 with stop losses below $55. Upside targets are $65 and $70. Silver tends to be more volatile than gold, requiring careful position sizing.
Platinum Analysis
Current price is approximately $1,973 per ounce. Platinum continues to gain traction from hydrogen infrastructure development and automotive demand. The World Platinum Investment Council projects a supply-demand gap exceeding one million ounces in 2026, with above-ground inventories depleting to critically low levels not seen since 2015.
Key support levels for platinum are at $1,800 to $1,820 and $1,540 to $1,600. Key resistance levels are at $2,000 and $2,100. The structural supply deficit positions platinum for significant price appreciation through 2030.
The forecast for platinum suggests potential trading within a range of $1,900 to $2,100 in the near term, with long-term targets of $2,200 to $2,500 by 2030. The hydrogen economy transition supports industrial demand.
Trading strategy for platinum involves buying near $1,950 to $1,980 with stop losses below $1,900. Targets are $2,050 and $2,100. The supply deficit fundamentals provide underlying support for this metal.
Trader Sentiment and Market Tips
Current trader sentiment is cautious with many participants reducing exposure ahead of key events. The US CPI print is expected to be the next major catalyst for precious metals, particularly regarding Federal Reserve policy direction.
Professional traders are focusing on the $4,000 gold level as the primary battleground. A sustained break above $4,200 could signal renewed bullish momentum, while a break below $3,950 could accelerate selling.
Risk management remains paramount in this environment. Traders should use tight stop losses and avoid overleveraging given the potential for sharp moves on geopolitical headlines.
Diversification across gold, silver, and platinum provides exposure to different demand drivers. Gold offers monetary hedge characteristics, silver provides industrial growth exposure, and platinum benefits from supply constraints and hydrogen economy development.
Long-term investors continue to hold precious metals as hedges against economic, political, and financial risks, while short-term traders are more reactive to daily news flow and technical levels.
The market is pricing in increased probability of further escalation in the Middle East, with traders preparing for potential volatility spikes. Any diplomatic breakthrough could trigger sharp reversals in current positioning.
Conclusion
The precious metals market is at a critical juncture with US-Iran tensions creating both opportunities and risks. Gold's defense of the $4,000 level will determine near-term direction. Silver and platinum offer alternative exposure with their own fundamental drivers. Traders should remain vigilant, use proper risk management, and be prepared for continued volatility as geopolitical developments unfold.
@Gate_Square
repost-content-media
  • Reward
  • 1
  • Repost
  • Share
HighAmbition:
Get on board now! 🚗
#BTC
Bitcoin has experienced a significant price correction over recent trading sessions, retreating from the $64,000 resistance level to approximately $61,850, representing a decline of approximately 3.36%. This pullback comes after a strong bullish momentum that drove BTC from the $57,000 support zone up to $64,000, marking a gain of roughly 12.28% during that upward trajectory. The current market dynamics are heavily influenced by escalating geopolitical tensions in the Middle East, particularly the renewed conflict involving Iran and the subsequent disruption of oil supply routes through
HighAmbition
#BTC
Bitcoin has experienced a significant price correction over recent trading sessions, retreating from the $64,000 resistance level to approximately $61,850, representing a decline of approximately 3.36%. This pullback comes after a strong bullish momentum that drove BTC from the $57,000 support zone up to $64,000, marking a gain of roughly 12.28% during that upward trajectory. The current market dynamics are heavily influenced by escalating geopolitical tensions in the Middle East, particularly the renewed conflict involving Iran and the subsequent disruption of oil supply routes through the Strait of Hormuz.
**The Bullish Rally From $57,000 to $64,000**
The previous bullish sentiment in Bitcoin's market was characterized by strong technical momentum and improving on-chain metrics. Bitcoin successfully broke above multiple resistance levels, with the $57,000 zone serving as a critical support foundation that attracted substantial buying interest. The rally gained traction as U.S. spot Bitcoin ETFs recorded their first positive inflows after a prolonged outflow streak, with approximately $222 million flowing into these investment vehicles. This institutional demand provided the necessary fuel for Bitcoin to challenge the $64,000 psychological resistance level, which represents a significant technical barrier that has historically acted as both support and resistance.
Technical indicators during this rally phase showed constructive patterns. The 50-day moving average provided dynamic support, with the slope indicating sustained upward momentum. The On-Balance Volume (OBV) indicator demonstrated strength, suggesting that buying pressure was accumulating alongside price appreciation. Additionally, Bitcoin maintained its position within the daily TBO Cloud, a technical framework that helps identify trend direction and potential reversal zones. The Relative Strength Index (RSI) remained below overbought territory for much of this ascent, indicating that the rally had room to continue without reaching exhaustion levels.
**Geopolitical Catalyst: Iran Conflict and Oil Supply Disruption**
The recent price decline from $64,000 to approximately $61,850 can be directly attributed to renewed geopolitical tensions in the Middle East. The conflict involving Iran has intensified, with the United States launching fresh airstrikes and revoking waivers that previously allowed Iran to sell oil globally. This development follows attacks on shipping vessels in the Strait of Hormuz, a critical chokepoint through which approximately 20% of global oil shipments pass. The disruption has sent shockwaves through global energy markets, with Brent crude oil jumping more than 2% to trade above $76 per barrel.
The Strait of Hormuz represents one of the most strategically important maritime passages in the world, and any disruption to its operations has immediate and far-reaching consequences for global markets. The U.S. Energy Information Administration has projected that global oil production will return to pre-conflict levels by the end of 2026, but the near-term uncertainty has created significant volatility across risk assets, including cryptocurrencies. Higher oil prices feed into inflation expectations, which in turn reduce the likelihood of Federal Reserve rate cuts and keep real yields elevated, creating a challenging environment for Bitcoin and other risk assets.
**Market Sentiment and Institutional Flows**
The current market sentiment reflects a cautious approach among institutional investors. Following the initial rally, strategic profit-taking has emerged as traders lock in gains ahead of potential further downside. The geopolitical uncertainty has triggered a risk-off sentiment across global markets, with investors rotating toward traditional safe-haven assets such as gold and U.S. Treasury bonds. However, Bitcoin's behavior during this crisis has been mixed, with some analysts noting that it continues to trade more like a risk asset rather than a digital safe haven.
U.S. spot Bitcoin ETFs have shown signs of stabilization after experiencing approximately $2.4 billion in outflows during June 2026, which represented the worst redemption streak since these products debuted in January 2024. The recent inflow of $222 million suggests that dip buyers are beginning to return to the market, though the sustainability of this trend remains uncertain given the ongoing geopolitical developments. Whale wallet activity and distribution patterns that characterized the period from October 2025 through February 2026 appear to be moderating, which could provide a foundation for price stabilization.
**Technical Analysis and Key Levels**
From a technical perspective, Bitcoin's current price action around $61,850 sits at a critical juncture. The $61,000 level represents a major invalidation area that, if breached, could trigger further downside toward the $57,000 to $58,000 support zone. Conversely, holding above this level maintains the bullish structure and keeps the door open for a retest of the $64,000 resistance. The 50-day moving average continues to provide dynamic support, and as long as Bitcoin maintains its position above this indicator, the intermediate-term trend remains constructive.
The $62,000 level serves as immediate resistance, with a break and consolidation above this threshold potentially opening the path toward $63,900 and subsequently $65,000. The Fibonacci retracement levels from the recent $57,000 to $64,000 move place the 38.2% retracement near $61,320 and the 50% retracement near $60,500, both of which could act as support zones if selling pressure intensifies. Volume analysis indicates that the recent pullback has occurred on relatively moderate volume compared to the preceding rally, suggesting that this correction may be more about profit-taking than a fundamental shift in market structure.
**Risk Factors and Strategic Considerations**
Multiple risk factors continue to weigh on Bitcoin's price trajectory. The Federal Reserve's monetary policy stance remains a critical variable, with the June meeting minutes potentially indicating a shift toward a more restrictive posture. Rising inflation expectations tied to the oil shock could delay anticipated rate cuts, maintaining pressure on risk assets. Additionally, continued outflows from Bitcoin ETFs would signal deteriorating institutional sentiment and could exacerbate downside price pressure.
The U.S. dollar's strength, as measured by the DXY index, remains technically bullish above the daily TBO Cloud, though RSI patterns suggest potential bearish divergence. The USDJPY currency pair has pushed above 162 without confirmed intervention from Japanese authorities, representing a macro concern that could impact global liquidity conditions. Equity markets have shown choppy behavior, with the S&P 500 futures closing back below short-term overhead resistance after briefly cracking that level.
**Strategic Trading Approach**
For traders navigating this environment, a balanced approach that respects both the bullish structure and the geopolitical risks appears most prudent. As long as Bitcoin holds above the $61,000 support level and maintains its position within the daily TBO Cloud, dips can be viewed as potential buying opportunities. However, traders should implement strict risk management protocols, with stop-loss orders placed below the $60,500 Fibonacci level to protect against a deeper correction.
The invalidation of the bullish thesis would occur on a sustained break below $61,000, which could trigger a move toward $57,000 or lower. Conversely, a successful defense of current support followed by a break above $63,900 would confirm bullish continuation and target $65,000 as the next major resistance. Traders should monitor ETF flow data, oil price movements, and any developments regarding the Strait of Hormuz as key catalysts that could shift market sentiment in either direction.
**Conclusion**
Bitcoin's journey from $57,000 to $64,000 and subsequent retreat to $61,850 illustrates the complex interplay between technical momentum and geopolitical risk. While the bullish structure remains intact above $61,000, the escalating Iran conflict and its impact on global energy markets have introduced significant uncertainty. Traders should remain vigilant, employing disciplined risk management while monitoring key technical levels and macro developments. The coming sessions will likely determine whether Bitcoin can consolidate above current levels and mount another challenge toward $65,000, or whether the geopolitical headwinds will force a deeper correction toward the $57,000 support zone.@Gate_Square
repost-content-media
  • Reward
  • 1
  • Repost
  • Share
HighAmbition:
To The Moon 🌕
  • Pinned