#USIranTalksPostponed
Les négociations de paix très attendues entre les États-Unis et l'Iran, prévues pour se tenir à Genève le 19 juin 2026, ont été officiellement reportées. Ce développement inattendu a provoqué des secousses sur les marchés financiers mondiaux, créant une incertitude et une volatilité importantes dans plusieurs classes d'actifs, y compris les cryptomonnaies, les métaux précieux et les produits énergétiques.
Contexte du report
La réunion diplomatique prévue entre les négociateurs américains et iraniens a été annulée suite à l'annulation par le vice-président JD Vance de son voyage en Suisse. Selon des rapports de Reuters et NPR, le report découle des opérations militaires israéliennes en cours au Liban, que l'Iran a qualifiées de violation directe du cadre sous-tendant les négociations de paix. Le ministère suisse des Affaires étrangères a confirmé que les discussions impliquant les États-Unis, l'Iran, le Qatar et le Pakistan ont été reportées indéfiniment, sans nouvelle date pour le moment.
La délégation iranienne avait initialement exigé de voir des signes concrets de la mise en œuvre par les États-Unis de l'accord provisoire avant de poursuivre les discussions techniques. L'agence de presse semi-officielle Tasnim a rapporté que l'Iran avait besoin d'une confirmation que Washington respecterait ses engagements dans le protocole d'accord signé plus tôt cette semaine. Cette hésitation, combinée aux frappes israéliennes continues dans le sud du Liban, a créé une impasse qui a conduit au report.
Impact sur le marché du Bitcoin et des cryptomonnaies
Le Bitcoin a connu une volatilité importante en réponse à l'incertitude géopolitique. Au 19 juin 2026, le Bitcoin se négocie autour de 62 500 à 64 230 dollars, ayant chuté par rapport à ses sommets récents au-dessus de 65 800 dollars. Le report a entraîné environ 192 millions de dollars de liquidations sur les principales cryptomonnaies, Ethereum étant la plus touchée, suivie par Bitcoin et XRP.
La réaction du marché des cryptomonnaies reflète un sentiment de risque accru chez les investisseurs. Lorsque les tensions géopolitiques s'intensifient, les traders ont tendance à se détourner des actifs risqués pour se réfugier dans des havres de sécurité. Malgré sa réputation de « or numérique », le Bitcoin a été négocié en étroite corrélation avec des actifs traditionnels à risque comme le Nasdaq et le S&P 500 plutôt que comme un véritable refuge en cette crise.
L’analyse technique montre que le Bitcoin est passé en dessous du niveau de Fibonacci 0,382 à 64 968 dollars, avec l’indicateur Supertrend devenant baissier à 68 399 dollars. Le niveau de Fibonacci 0,236 à 62 725 dollars représente la dernière ligne de défense avant un éventuel test du plus bas absolu de juin à 59 098 dollars. Les analystes surveillent de près ces niveaux alors que l’incertitude autour des négociations US-Iran persiste.
Le marché des cryptomonnaies s’était initialement redressé le 15 juin lorsque la nouvelle d’un accord de paix préliminaire est apparue, avec le Bitcoin retrouvant plus de 64 000 dollars. Cependant, le report a inversé ces gains alors que les traders réévaluent la probabilité d’une résolution durable. Ce schéma montre à quel point les prix des cryptomonnaies restent sensibles aux développements géopolitiques, notamment ceux impliquant des régions productrices de pétrole majeures.
Impact sur le marché de l’or
Les prix de l’or ont montré des réactions mitigées face à la nouvelle de report. Après avoir initialement progressé au-dessus de 4 300 dollars l’once, en raison de l’optimisme concernant l’accord de paix, l’or s’est depuis replié à environ 4 147 à 4 184 dollars l’once au 19 juin 2026. Le métal précieux est actuellement en voie de connaître sa troisième baisse hebdomadaire consécutive.
L’accord de paix initial avait entraîné une baisse de l’or, car la chute des prix du pétrole avait réduit les attentes d’inflation. Cependant, le report a réintroduit de l’incertitude, ce qui soutient généralement les prix de l’or. L’or au comptant a chuté de 1,38 % le 19 juin, se négociant à 4 151,74 dollars l’once, en baisse par rapport à ses sommets récents au-dessus de 4 300 dollars.
Goldman Sachs maintient son objectif de fin d’année à 4 900 dollars l’once, bien que cette prévision ait été revue à la baisse par rapport à une projection antérieure de 5 400 dollars. JPMorgan vise 5 000 dollars l’once, avec 6 000 dollars comme possibilité à plus long terme. Ces cibles reflètent les attentes que les tensions géopolitiques et les préoccupations inflationnistes finiront par soutenir les prix des métaux précieux.
L’analyse technique indique des niveaux de support clés pour l’or à 4 100 dollars, avec un support plus profond à 4 023 dollars et le niveau psychologique important de 4 000 dollars. La résistance est observée à 4 170, 4 200 et 4 300 dollars. Les analystes notent que la dynamique reste baissière à court terme pour l’or, bien que la demande de refuge puisse resurgir si les tensions s’intensifient davantage.
Impact sur le marché pétrolier
Les marchés du pétrole ont connu une volatilité importante autour du report de paix. Le Brent se négocie actuellement entre 79,56 et 80,38 dollars le baril, en baisse par rapport à environ 94 dollars au début juin 2026. Le report a créé de l’incertitude quant au moment où les approvisionnements en pétrole iranien reviendront sur le marché mondial.
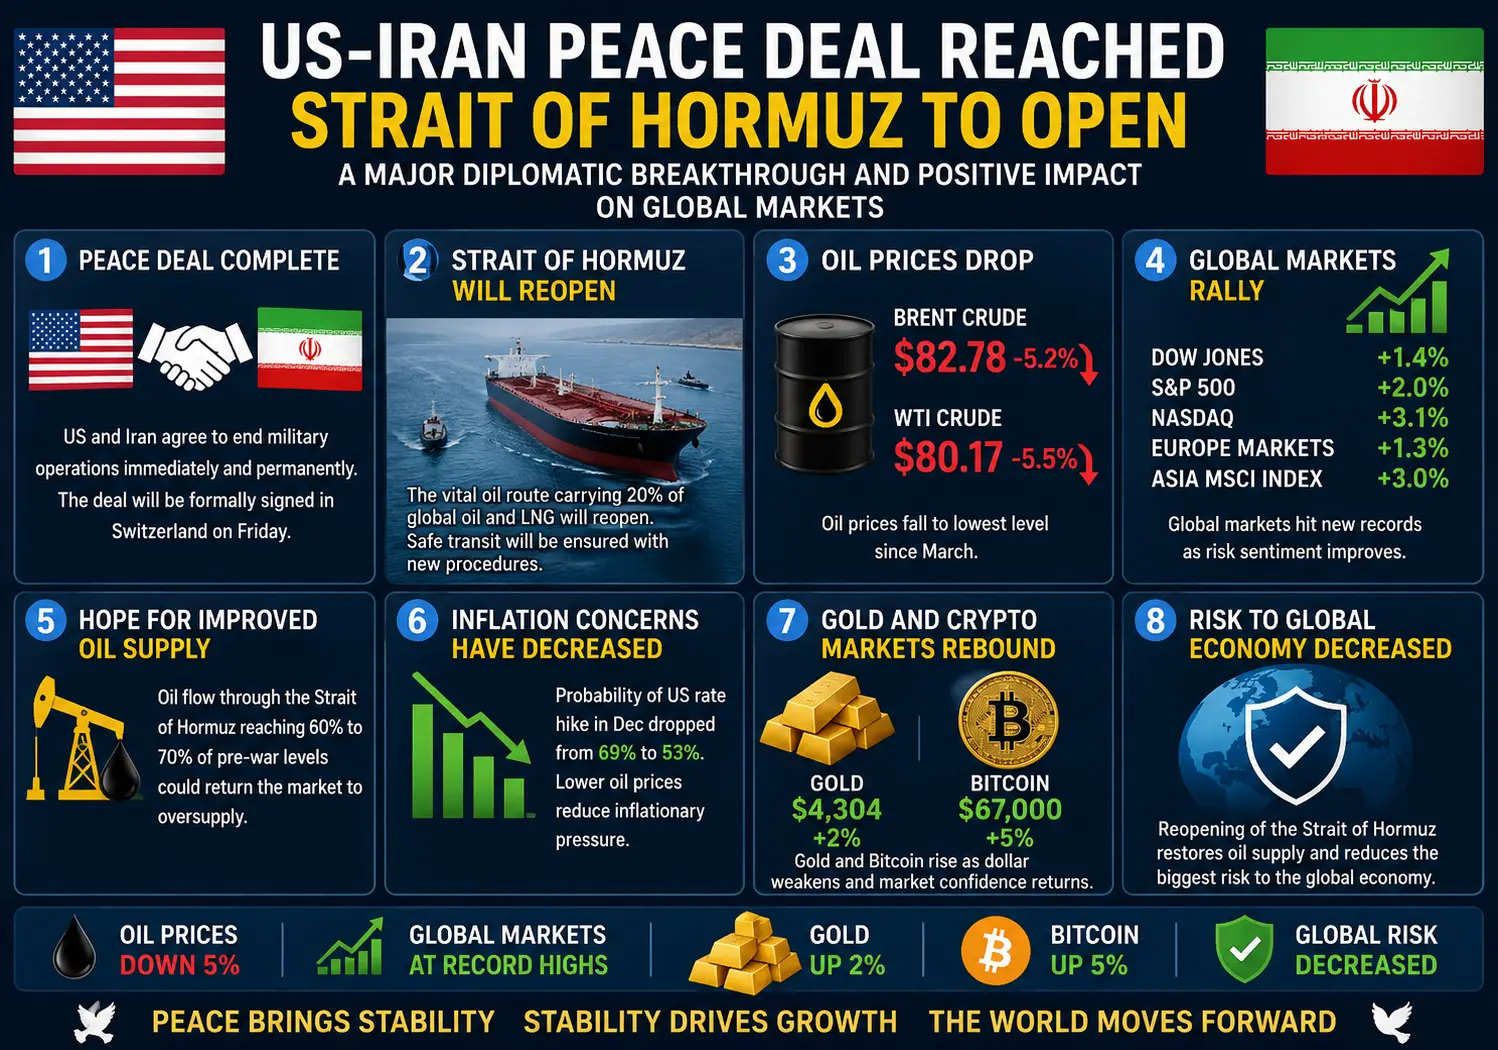
L’accord de paix préliminaire signé plus tôt dans la semaine avait provoqué une chute de près de 5 % des prix du pétrole, atteignant leurs niveaux les plus bas depuis le 4 mars, alors que les marchés anticipaient la réouverture du détroit d’Hormuz. Ce passage stratégique transporte habituellement un cinquième de l’approvisionnement mondial en pétrole, et sa fermeture lors du conflit avait retiré environ 14 millions de barils par jour de l’offre mondiale.
Cependant, le report a soulevé des questions sur le calendrier de la reprise du trafic normal à travers le détroit. Bien que certains pétroliers aient commencé à passer par le détroit d’Hormuz après l’accord provisoire, la restauration complète de l’approvisionnement pourrait prendre plus de temps que prévu initialement. Les analystes suggèrent que les prix ne reviendront probablement pas aux niveaux d’avant la crise avant que les stocks de pétrole brut et d’essence ne soient reconstitués, ce qui pourrait ne pas se produire avant la fin 2026.
Le prix moyen national de l’essence aux États-Unis est tombé en dessous de 4 dollars le gallon pour la première fois en près de trois mois, reflétant l’optimisme initial concernant l’accord de paix. Cependant, une progression soutenue dans les négociations sera nécessaire pour maintenir ces prix plus bas.
Perspectives du marché et facteurs clés à surveiller
Les investisseurs et traders doivent suivre plusieurs variables critiques dans les prochains jours et semaines :
1. **Développements diplomatiques** : Le statut des canaux diplomatiques US-Iran reste le principal moteur du sentiment du marché. Toute annonce concernant un report ou une avancée dans les négociations pourrait déclencher des mouvements importants.
2. **Activité militaire israélienne** : La poursuite des opérations israéliennes au Liban représente un obstacle majeur aux négociations de paix. Une désescalade dans le sud du Liban améliorerait les perspectives de succès.
3. **Politique de la Réserve fédérale** : La position hawkish de la Fed, avec neuf des dix-neuf décideurs anticipant des hausses de taux en 2026, ajoute une couche de complexité supplémentaire. Des taux plus élevés exercent généralement une pression sur les cryptomonnaies et l’or.
4. **Restitution de l’approvisionnement en pétrole** : La vitesse à laquelle le pétrole iranien reviendra sur le marché mondial influencera fortement les prix de l’énergie et les attentes inflationnistes plus larges.
5. **Flux vers les havres de sécurité** : Les actifs traditionnels refuges comme l’or et le dollar américain pourraient bénéficier de l’incertitude persistante, tandis que les actifs risqués, y compris les cryptomonnaies, pourraient subir une pression supplémentaire.
Conclusion
Le report des négociations de paix US-Iran a introduit une incertitude importante sur les marchés mondiaux, affectant le Bitcoin, l’or et le pétrole de manières distinctes. Le Bitcoin a chuté vers 62 500 dollars dans un contexte de sentiment de risque accru et d’événements de liquidation. L’or s’est replié à environ 4 150 dollars l’once malgré son statut de refuge, sous la pression des attentes liées à la politique de la Fed. Les prix du pétrole restent volatils autour de 80 dollars le baril alors que les marchés évaluent le calendrier de la reprise de l’approvisionnement iranien.
La situation demeure fluide, les marchés étant très sensibles à toute évolution concernant le report ou l’aggravation des tensions régionales. Les investisseurs doivent rester vigilants face aux risques géopolitiques tout en surveillant les niveaux techniques de ces classes d’actifs clés. Les prochains jours seront cruciaux pour déterminer si les efforts diplomatiques peuvent reprendre leur cours ou si les marchés devront intégrer une période prolongée d’incertitude.@Gate_Square
Les négociations de paix très attendues entre les États-Unis et l'Iran, prévues pour se tenir à Genève le 19 juin 2026, ont été officiellement reportées. Ce développement inattendu a provoqué des secousses sur les marchés financiers mondiaux, créant une incertitude et une volatilité importantes dans plusieurs classes d'actifs, y compris les cryptomonnaies, les métaux précieux et les produits énergétiques.
Contexte du report
La réunion diplomatique prévue entre les négociateurs américains et iraniens a été annulée suite à l'annulation par le vice-président JD Vance de son voyage en Suisse. Selon des rapports de Reuters et NPR, le report découle des opérations militaires israéliennes en cours au Liban, que l'Iran a qualifiées de violation directe du cadre sous-tendant les négociations de paix. Le ministère suisse des Affaires étrangères a confirmé que les discussions impliquant les États-Unis, l'Iran, le Qatar et le Pakistan ont été reportées indéfiniment, sans nouvelle date pour le moment.
La délégation iranienne avait initialement exigé de voir des signes concrets de la mise en œuvre par les États-Unis de l'accord provisoire avant de poursuivre les discussions techniques. L'agence de presse semi-officielle Tasnim a rapporté que l'Iran avait besoin d'une confirmation que Washington respecterait ses engagements dans le protocole d'accord signé plus tôt cette semaine. Cette hésitation, combinée aux frappes israéliennes continues dans le sud du Liban, a créé une impasse qui a conduit au report.
Impact sur le marché du Bitcoin et des cryptomonnaies
Le Bitcoin a connu une volatilité importante en réponse à l'incertitude géopolitique. Au 19 juin 2026, le Bitcoin se négocie autour de 62 500 à 64 230 dollars, ayant chuté par rapport à ses sommets récents au-dessus de 65 800 dollars. Le report a entraîné environ 192 millions de dollars de liquidations sur les principales cryptomonnaies, Ethereum étant la plus touchée, suivie par Bitcoin et XRP.
La réaction du marché des cryptomonnaies reflète un sentiment de risque accru chez les investisseurs. Lorsque les tensions géopolitiques s'intensifient, les traders ont tendance à se détourner des actifs risqués pour se réfugier dans des havres de sécurité. Malgré sa réputation de « or numérique », le Bitcoin a été négocié en étroite corrélation avec des actifs traditionnels à risque comme le Nasdaq et le S&P 500 plutôt que comme un véritable refuge en cette crise.
L’analyse technique montre que le Bitcoin est passé en dessous du niveau de Fibonacci 0,382 à 64 968 dollars, avec l’indicateur Supertrend devenant baissier à 68 399 dollars. Le niveau de Fibonacci 0,236 à 62 725 dollars représente la dernière ligne de défense avant un éventuel test du plus bas absolu de juin à 59 098 dollars. Les analystes surveillent de près ces niveaux alors que l’incertitude autour des négociations US-Iran persiste.
Le marché des cryptomonnaies s’était initialement redressé le 15 juin lorsque la nouvelle d’un accord de paix préliminaire est apparue, avec le Bitcoin retrouvant plus de 64 000 dollars. Cependant, le report a inversé ces gains alors que les traders réévaluent la probabilité d’une résolution durable. Ce schéma montre à quel point les prix des cryptomonnaies restent sensibles aux développements géopolitiques, notamment ceux impliquant des régions productrices de pétrole majeures.
Impact sur le marché de l’or
Les prix de l’or ont montré des réactions mitigées face à la nouvelle de report. Après avoir initialement progressé au-dessus de 4 300 dollars l’once, en raison de l’optimisme concernant l’accord de paix, l’or s’est depuis replié à environ 4 147 à 4 184 dollars l’once au 19 juin 2026. Le métal précieux est actuellement en voie de connaître sa troisième baisse hebdomadaire consécutive.
L’accord de paix initial avait entraîné une baisse de l’or, car la chute des prix du pétrole avait réduit les attentes d’inflation. Cependant, le report a réintroduit de l’incertitude, ce qui soutient généralement les prix de l’or. L’or au comptant a chuté de 1,38 % le 19 juin, se négociant à 4 151,74 dollars l’once, en baisse par rapport à ses sommets récents au-dessus de 4 300 dollars.
Goldman Sachs maintient son objectif de fin d’année à 4 900 dollars l’once, bien que cette prévision ait été revue à la baisse par rapport à une projection antérieure de 5 400 dollars. JPMorgan vise 5 000 dollars l’once, avec 6 000 dollars comme possibilité à plus long terme. Ces cibles reflètent les attentes que les tensions géopolitiques et les préoccupations inflationnistes finiront par soutenir les prix des métaux précieux.
L’analyse technique indique des niveaux de support clés pour l’or à 4 100 dollars, avec un support plus profond à 4 023 dollars et le niveau psychologique important de 4 000 dollars. La résistance est observée à 4 170, 4 200 et 4 300 dollars. Les analystes notent que la dynamique reste baissière à court terme pour l’or, bien que la demande de refuge puisse resurgir si les tensions s’intensifient davantage.
Impact sur le marché pétrolier
Les marchés du pétrole ont connu une volatilité importante autour du report de paix. Le Brent se négocie actuellement entre 79,56 et 80,38 dollars le baril, en baisse par rapport à environ 94 dollars au début juin 2026. Le report a créé de l’incertitude quant au moment où les approvisionnements en pétrole iranien reviendront sur le marché mondial.
L’accord de paix préliminaire signé plus tôt dans la semaine avait provoqué une chute de près de 5 % des prix du pétrole, atteignant leurs niveaux les plus bas depuis le 4 mars, alors que les marchés anticipaient la réouverture du détroit d’Hormuz. Ce passage stratégique transporte habituellement un cinquième de l’approvisionnement mondial en pétrole, et sa fermeture lors du conflit avait retiré environ 14 millions de barils par jour de l’offre mondiale.
Cependant, le report a soulevé des questions sur le calendrier de la reprise du trafic normal à travers le détroit. Bien que certains pétroliers aient commencé à passer par le détroit d’Hormuz après l’accord provisoire, la restauration complète de l’approvisionnement pourrait prendre plus de temps que prévu initialement. Les analystes suggèrent que les prix ne reviendront probablement pas aux niveaux d’avant la crise avant que les stocks de pétrole brut et d’essence ne soient reconstitués, ce qui pourrait ne pas se produire avant la fin 2026.
Le prix moyen national de l’essence aux États-Unis est tombé en dessous de 4 dollars le gallon pour la première fois en près de trois mois, reflétant l’optimisme initial concernant l’accord de paix. Cependant, une progression soutenue dans les négociations sera nécessaire pour maintenir ces prix plus bas.
Perspectives du marché et facteurs clés à surveiller
Les investisseurs et traders doivent suivre plusieurs variables critiques dans les prochains jours et semaines :
1. **Développements diplomatiques** : Le statut des canaux diplomatiques US-Iran reste le principal moteur du sentiment du marché. Toute annonce concernant un report ou une avancée dans les négociations pourrait déclencher des mouvements importants.
2. **Activité militaire israélienne** : La poursuite des opérations israéliennes au Liban représente un obstacle majeur aux négociations de paix. Une désescalade dans le sud du Liban améliorerait les perspectives de succès.
3. **Politique de la Réserve fédérale** : La position hawkish de la Fed, avec neuf des dix-neuf décideurs anticipant des hausses de taux en 2026, ajoute une couche de complexité supplémentaire. Des taux plus élevés exercent généralement une pression sur les cryptomonnaies et l’or.
4. **Restitution de l’approvisionnement en pétrole** : La vitesse à laquelle le pétrole iranien reviendra sur le marché mondial influencera fortement les prix de l’énergie et les attentes inflationnistes plus larges.
5. **Flux vers les havres de sécurité** : Les actifs traditionnels refuges comme l’or et le dollar américain pourraient bénéficier de l’incertitude persistante, tandis que les actifs risqués, y compris les cryptomonnaies, pourraient subir une pression supplémentaire.
Conclusion
Le report des négociations de paix US-Iran a introduit une incertitude importante sur les marchés mondiaux, affectant le Bitcoin, l’or et le pétrole de manières distinctes. Le Bitcoin a chuté vers 62 500 dollars dans un contexte de sentiment de risque accru et d’événements de liquidation. L’or s’est replié à environ 4 150 dollars l’once malgré son statut de refuge, sous la pression des attentes liées à la politique de la Fed. Les prix du pétrole restent volatils autour de 80 dollars le baril alors que les marchés évaluent le calendrier de la reprise de l’approvisionnement iranien.
La situation demeure fluide, les marchés étant très sensibles à toute évolution concernant le report ou l’aggravation des tensions régionales. Les investisseurs doivent rester vigilants face aux risques géopolitiques tout en surveillant les niveaux techniques de ces classes d’actifs clés. Les prochains jours seront cruciaux pour déterminer si les efforts diplomatiques peuvent reprendre leur cours ou si les marchés devront intégrer une période prolongée d’incertitude.@Gate_Square