EastChainSuperBrother

vip
Active for: 0.4y
Peak Tier 0
No content yet
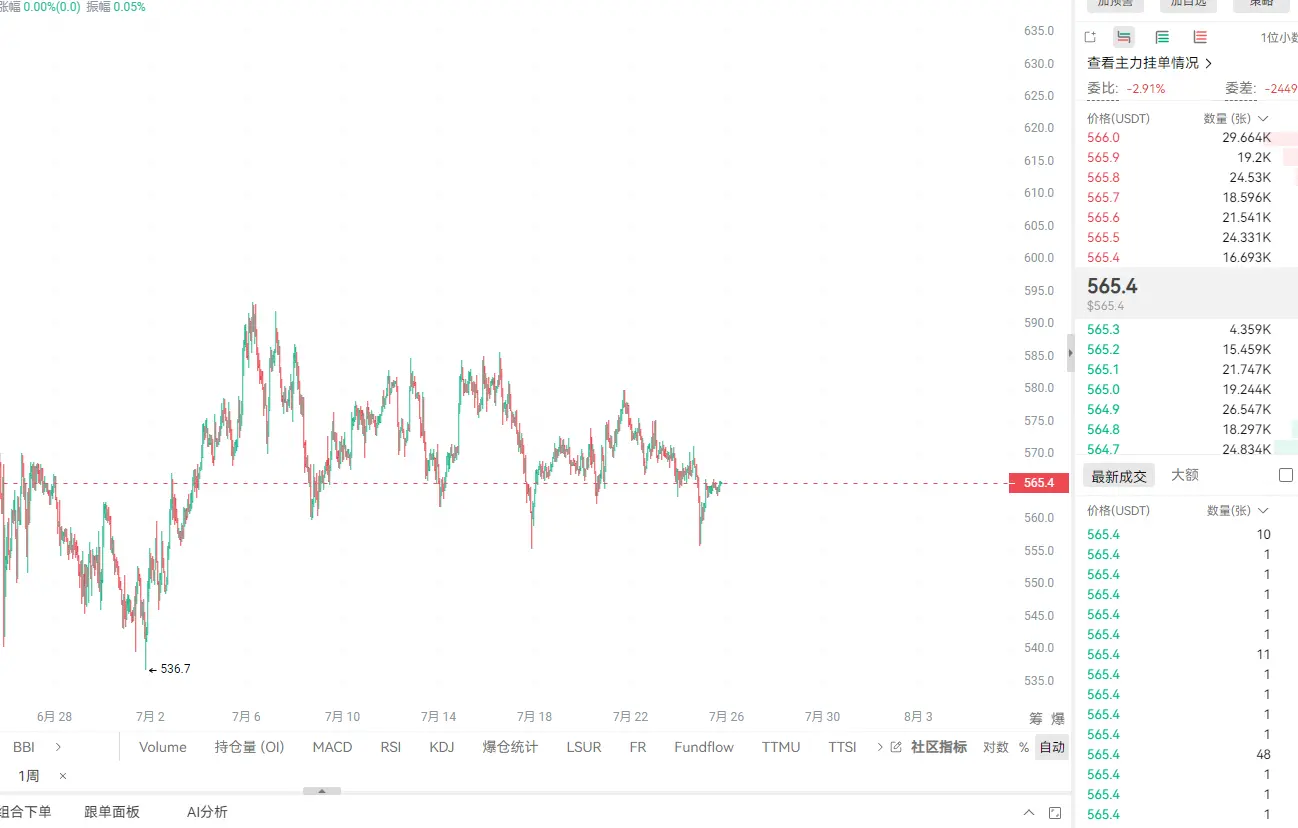
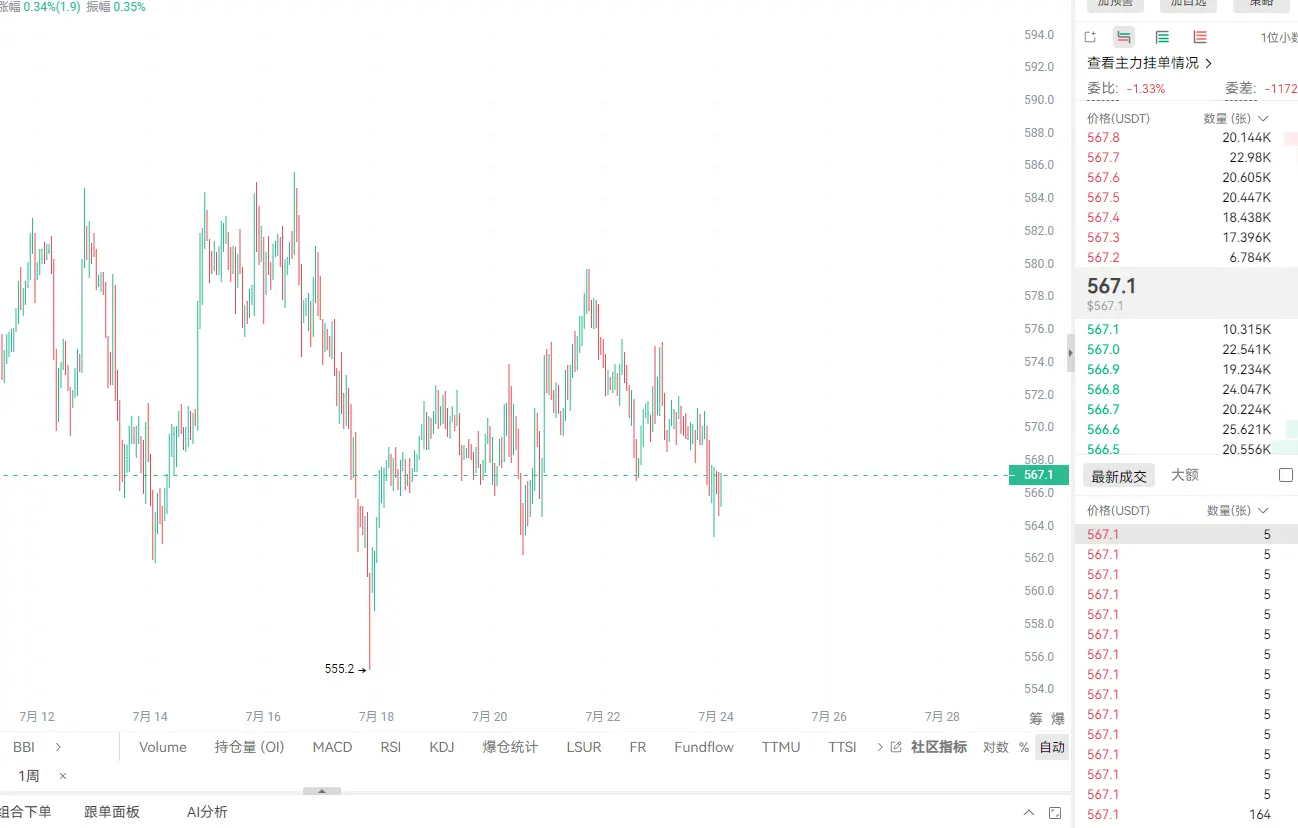
BNB today has been ranging and consolidating around 565 to 573u, with the previous close at 579u; it dropped earlier this morning.
Over the past two days, overall market risk appetite has been returning. BTC has risen above 65ku, and the Nasdaq is also up, but BNB hasn’t kept up today—its price action is relatively weak.
A certain BNB Chain has some data over the past two days: 24-hour transaction fee revenue is $220k, and the project team’s net revenue is $22,200. This is at a normal level—nothing particularly special.
For price performance, over the past 12 months it has fallen by nearly 18%
BNB1.14%
BTC-0.22%
NAS100-0.73%
View Original
post-image
  • Reward
  • Comment
  • Repost
  • Share
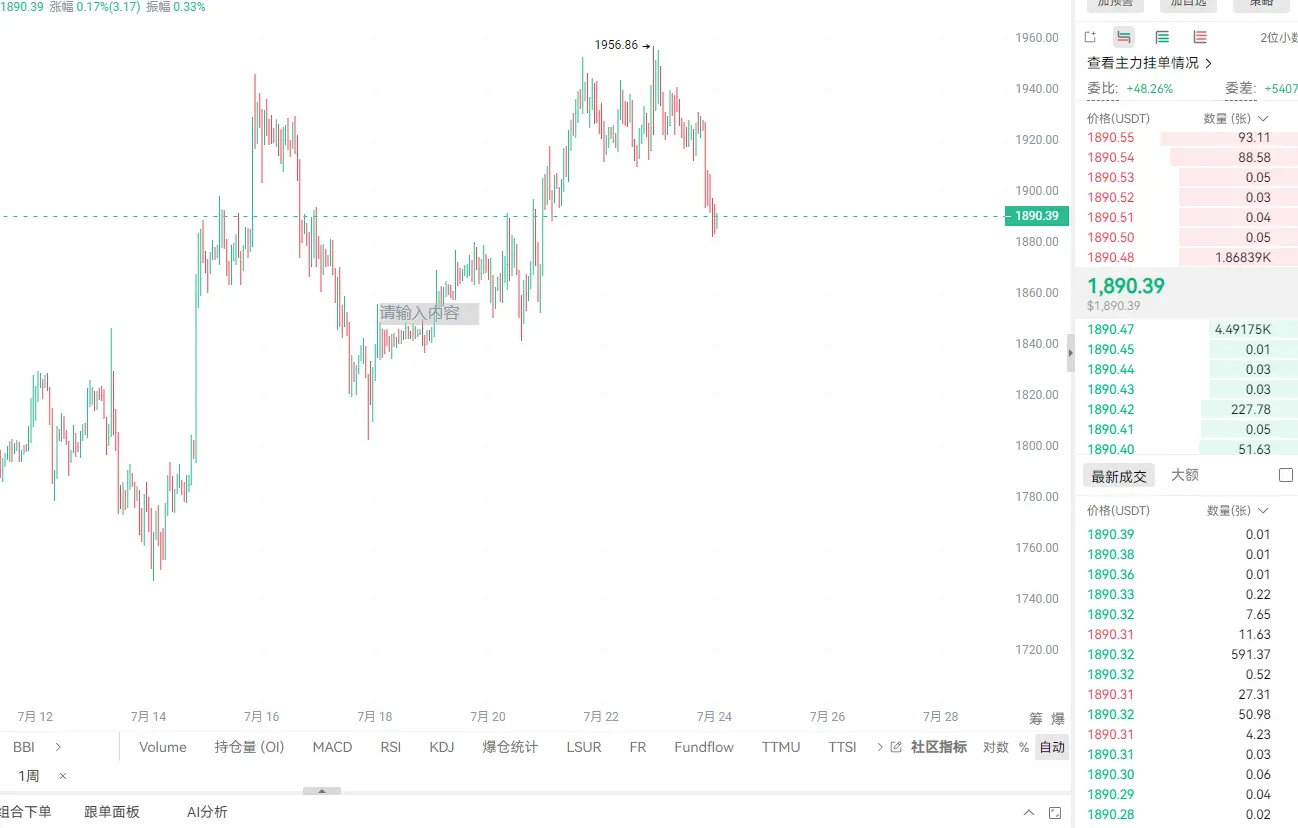
ETH today has risen to around 1940u, up 76u earlier than yesterday. Over the past two days, risk appetite in the market has returned.
BTC has also climbed together to above 66ku. Nasdaq tech stocks have been rising these past couple of days too. This crypto move is following the traditional market’s risk sentiment and warming up as well.
However, this rally isn’t particularly solid yet—there are still a lot of “mega whales” that haven’t fully returned. More of it is short-term funds that have moved first. Second-quarter earnings reports haven’t all been released yet, and the market is still di
ETH0.12%
BTC-0.22%
NAS100-1.50%
View Original
  • Reward
  • Comment
  • Repost
  • Share
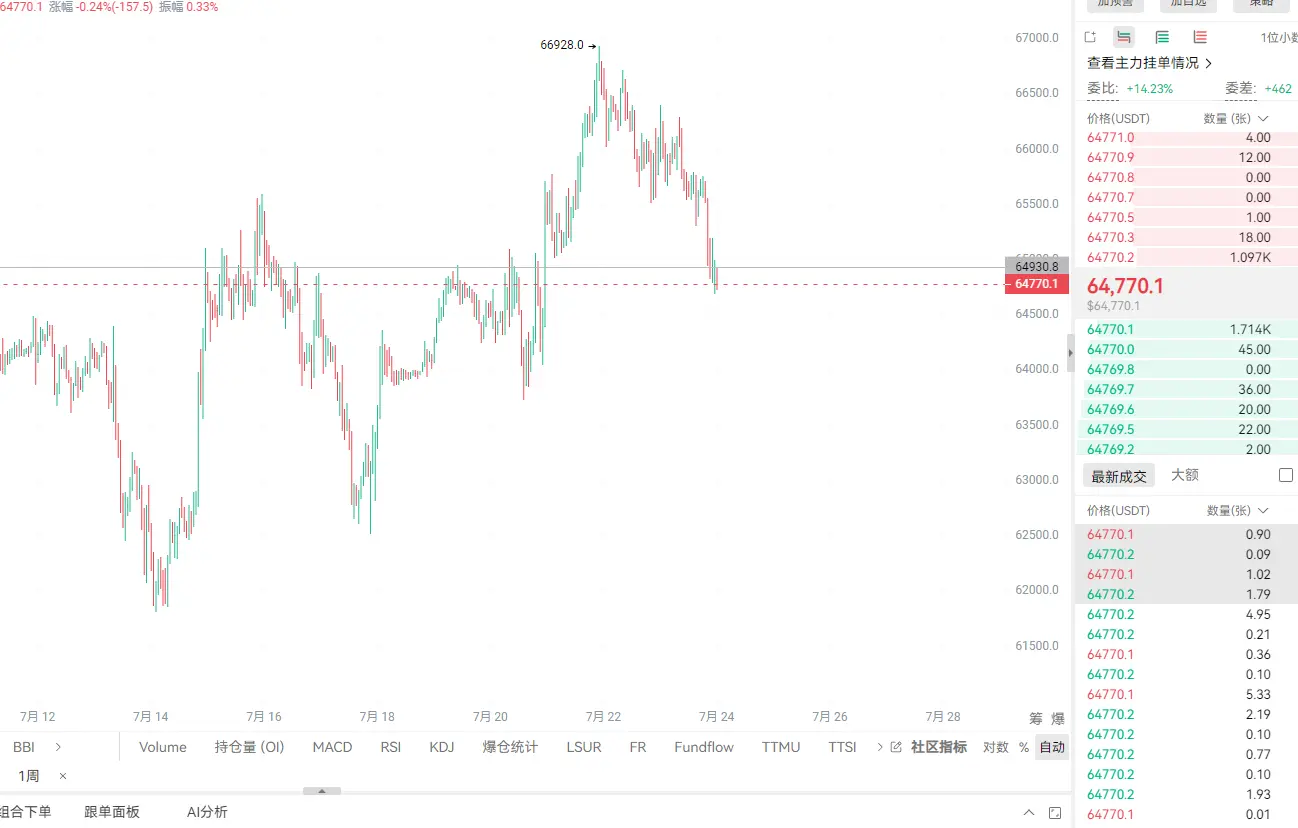
BTC is hovering around 65900u today. The daily and hourly charts are telling two different stories right now.
From the daily perspective, the price is struggling in the 65488u to 66527u range. The MACD is lifting, indicating momentum is building, but on the hourly timeframe, momentum has already started to weaken—the bulls haven’t yet gained structural control.
The daily pivot is at 66114u. Above that, the upper Bollinger Band is at 66263u and the hourly 20 EMA is at 66145u. This area is a dense sell-pressure zone, and the bulls haven’t been able to clear it cleanly for now.
First, you need to
BTC-0.22%
View Original
  • Reward
  • Comment
  • Repost
  • Share
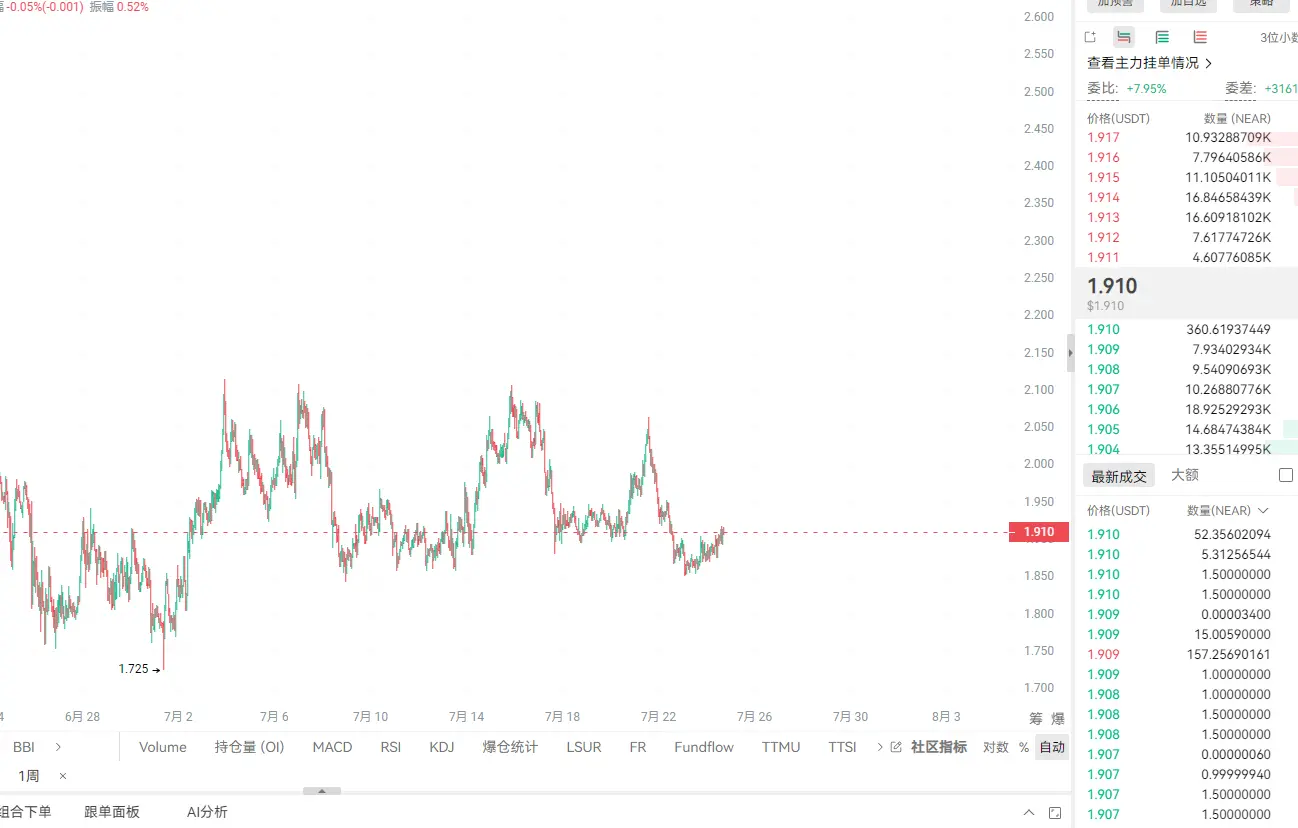
NEAR is around 1.91 u now. It’s been moving up nicely today—up by more than two points. The 24-hour high and low are both right around the current price, and the overall momentum is basically a steady upward climb.
However, looking at it over a longer period, it’s still down for the week—down by more than 1 point. It’s also down by more than 2 points over the month, which suggests the earlier trend has been relatively weak. Today’s move can be counted as a short-term rebound, but it’s still not enough to say the trend has truly turned stronger.
It’s down more than 90% from its all-time high of
View Original
post-image
  • Reward
  • 1
  • Repost
  • Share
Lisnawati85:
To The Moon 🌕
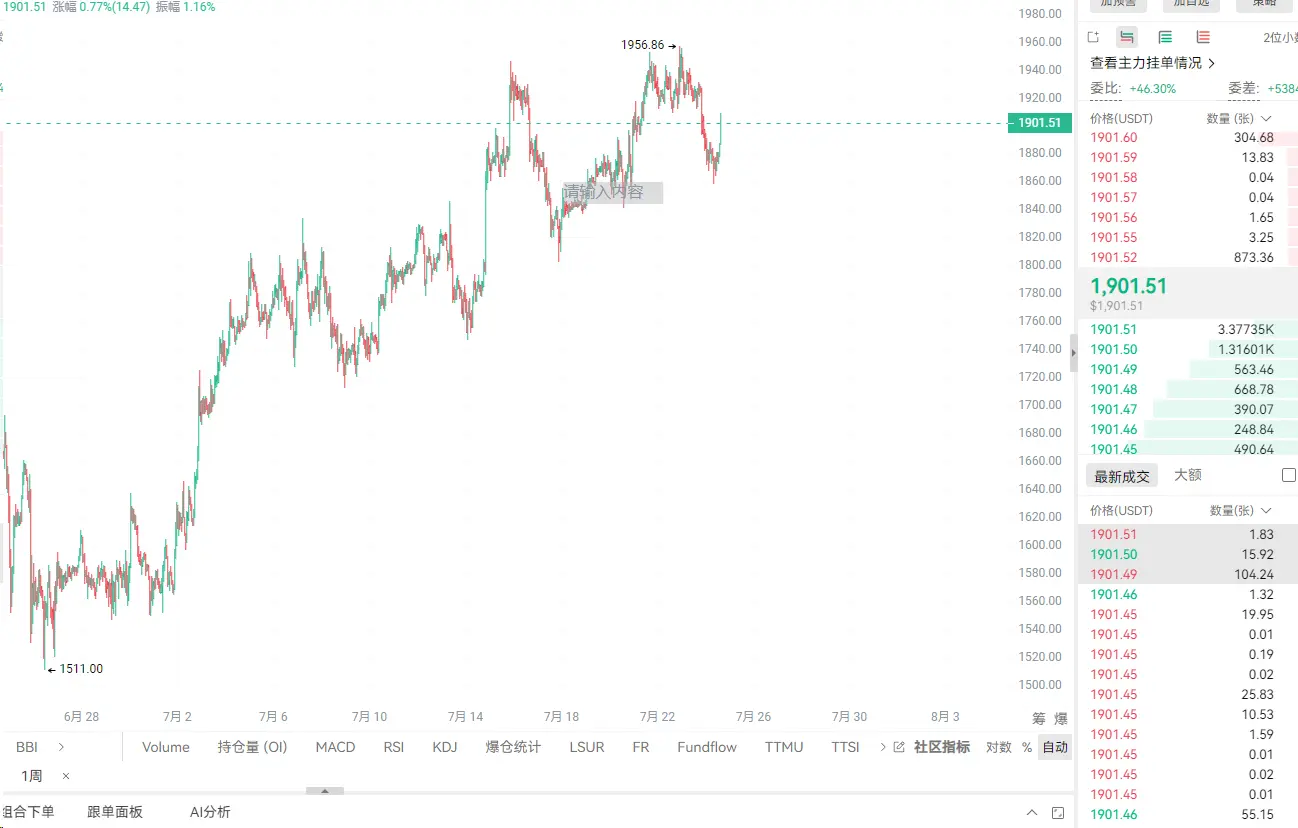
ETH current price is 1889u. Take-profit is around 1980. Set the stop-loss below 1860.
This monthly candle is up nearly 13% in this move, and this week has also continued to rise by more than 3%. The trend is relatively strong. Today there’s a small pullback—down by less than 2 points—which is normal noise and doesn’t affect the bigger direction.
Entering long at this current level has about 4% room left to the 1980 take-profit level. Once it breaks above 1930, the previous high, things should run more smoothly as sentiment improves. The stop-loss is placed below 1860—this is leaving a bit of b
ETH0.12%
View Original
post-image
  • Reward
  • Comment
  • Repost
  • Share
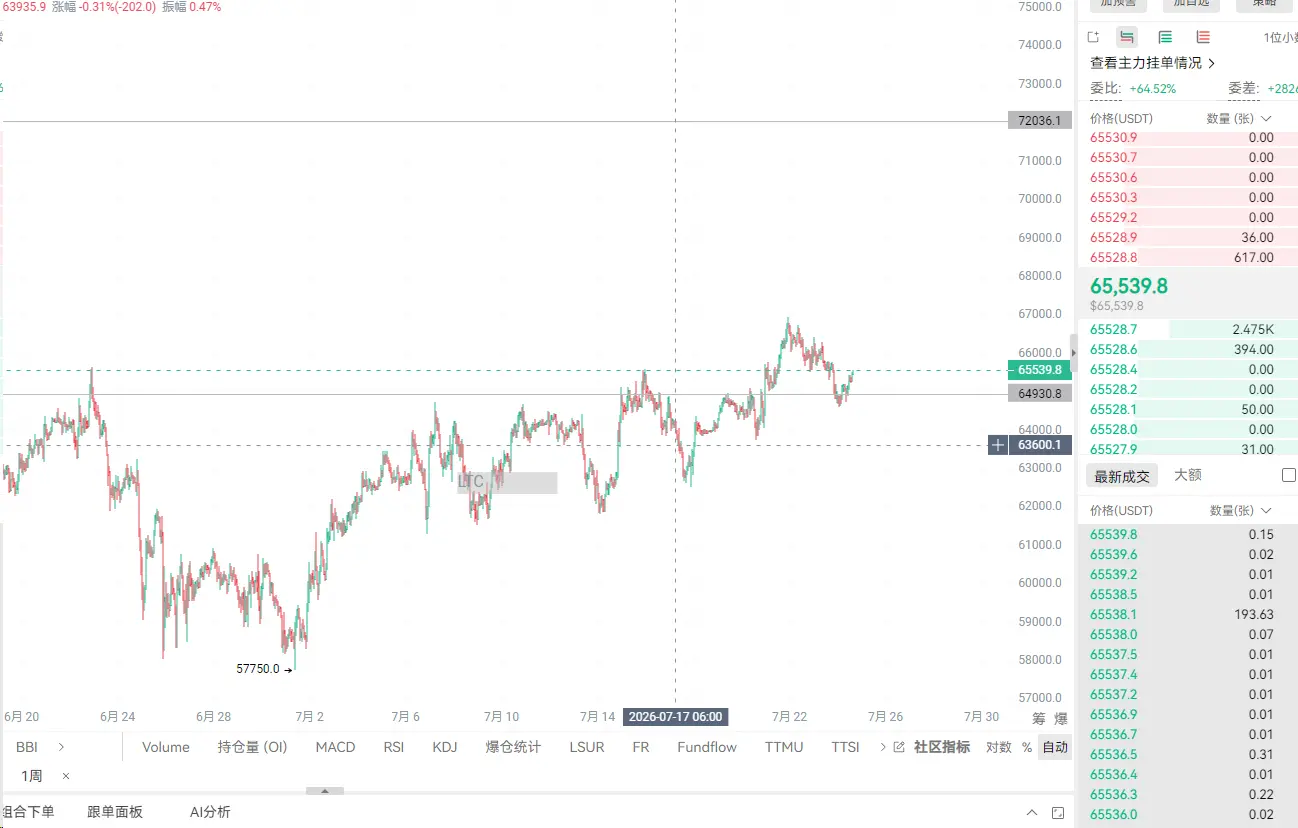
BTC has opened a long directly at 65,400 these past two days.
BTC has been grinding back and forth in the range of 65.0k to 66.0k these two days; today it dipped a bit downward. The current price is around 65.4k, and it has already touched the lower edge of the wedge line.
I previously kept thinking it would come to a deeper support in the 63.5k range, but this dip arrived and then held—there was no chance for it to go that low at all. This shows that the bulls’ willingness to pick up bids is stronger than expected; they don’t want it to fall too deeply.
Now this level is right at the wedge lo
BTC-0.22%
View Original
post-image
  • Reward
  • Comment
  • Repost
  • Share
UNI is now around 3.85. This month has been moving pretty hard—up more than 30%. Over a week, it’s also risen by nearly 8%. It’s one of the better-performing coins in the recent period.
But today, it hasn’t really moved. The daily change is only a few tenths of a percent. The high was 3.87 and the low was 3.73—looks like it’s taking a breather after running up.
It’s still far from the all-time high of 45. It’s down by more than 90% as well. So even though this leg of gains is sizable, the position is still relatively low.
A near doubling in a month usually means there’s actually money flowing
UNI-2.04%
View Original
  • Reward
  • Comment
  • Repost
  • Share
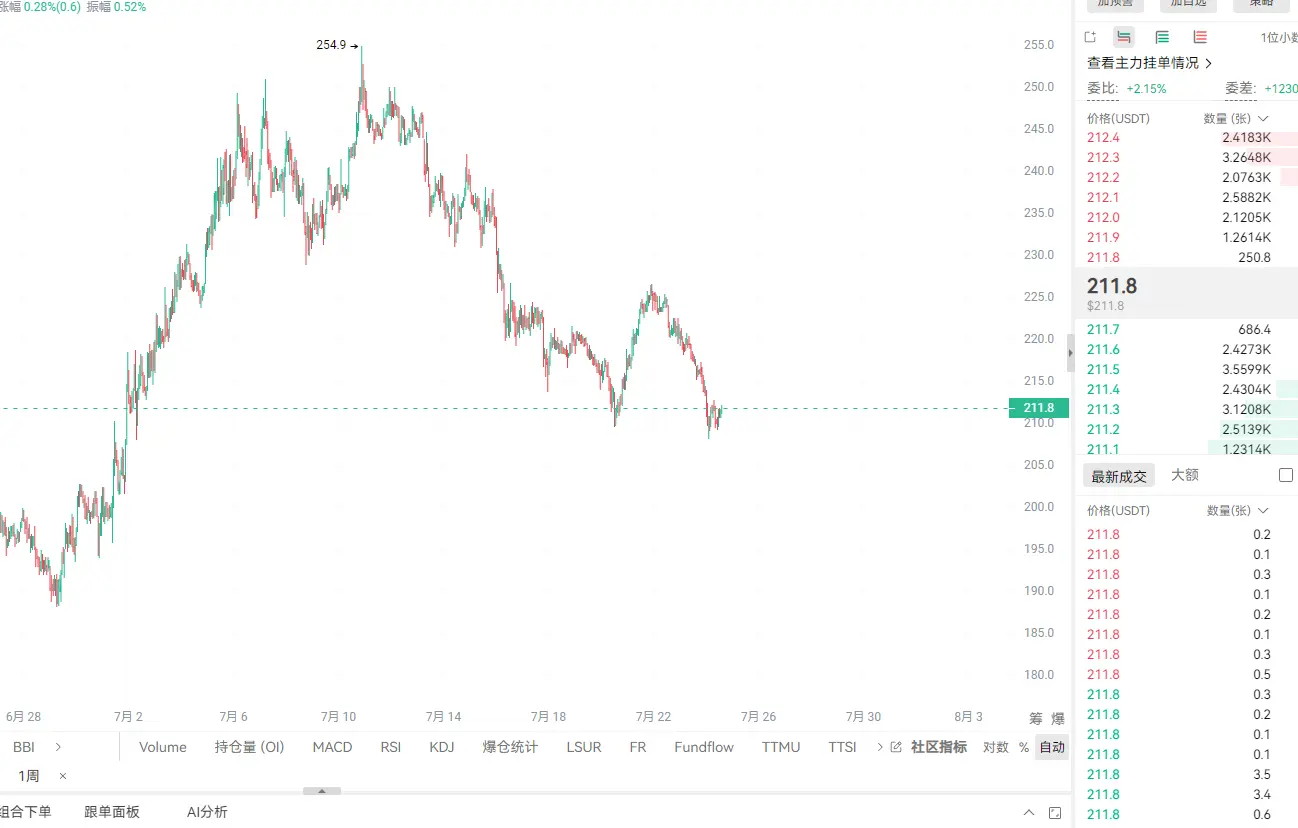
BCH is currently around 212 u. Today it’s fallen by nearly 3%, and this week it hasn’t been light either—over the week it’s down more than 5%.
But if you stretch it to a month, the books are still up—up by nearly one tenth, which indicates there was a rally earlier and this week started giving back the gains. At its 24-hour high it was around 217, and at its low around 209. The swings aren’t small.
This kind of pattern—up over a month, then down a chunk over the recent week—is basically the typical “sell the spike” after reaching a high. People who entered earlier start gradually exiting, slow
BCH0.66%
View Original
post-image
  • Reward
  • Comment
  • Repost
  • Share
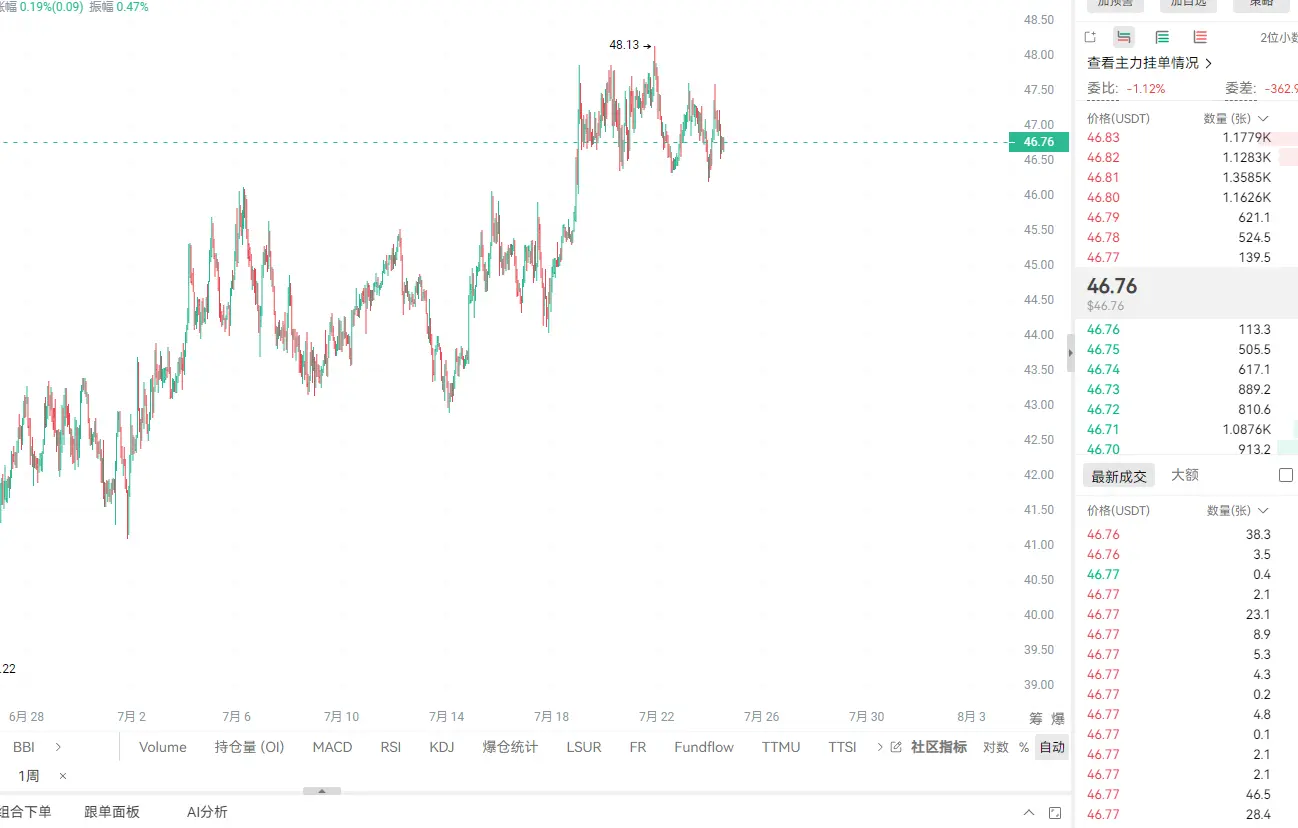
LTC is now around 46.7u. It’s down a very large amount from its all-time high of 410, falling by nearly 90%.
But in recent weeks it has really been rising: up about 5% over the week, and nearly 10% over the month. It’s one of the older coins that has been moving relatively strongly over the past few days. Its 24-hour fluctuations aren’t big: the high is around 47.5, and the low around 46.6. After the rise, it’s basically taking a breather.
If it can drop this deep and still keep rebounding, it suggests there are buyers picking up at the bottom. Sentiment isn’t too bad. Also, as a very old asse
LTC-0.54%
View Original
post-image
  • Reward
  • Comment
  • Repost
  • Share
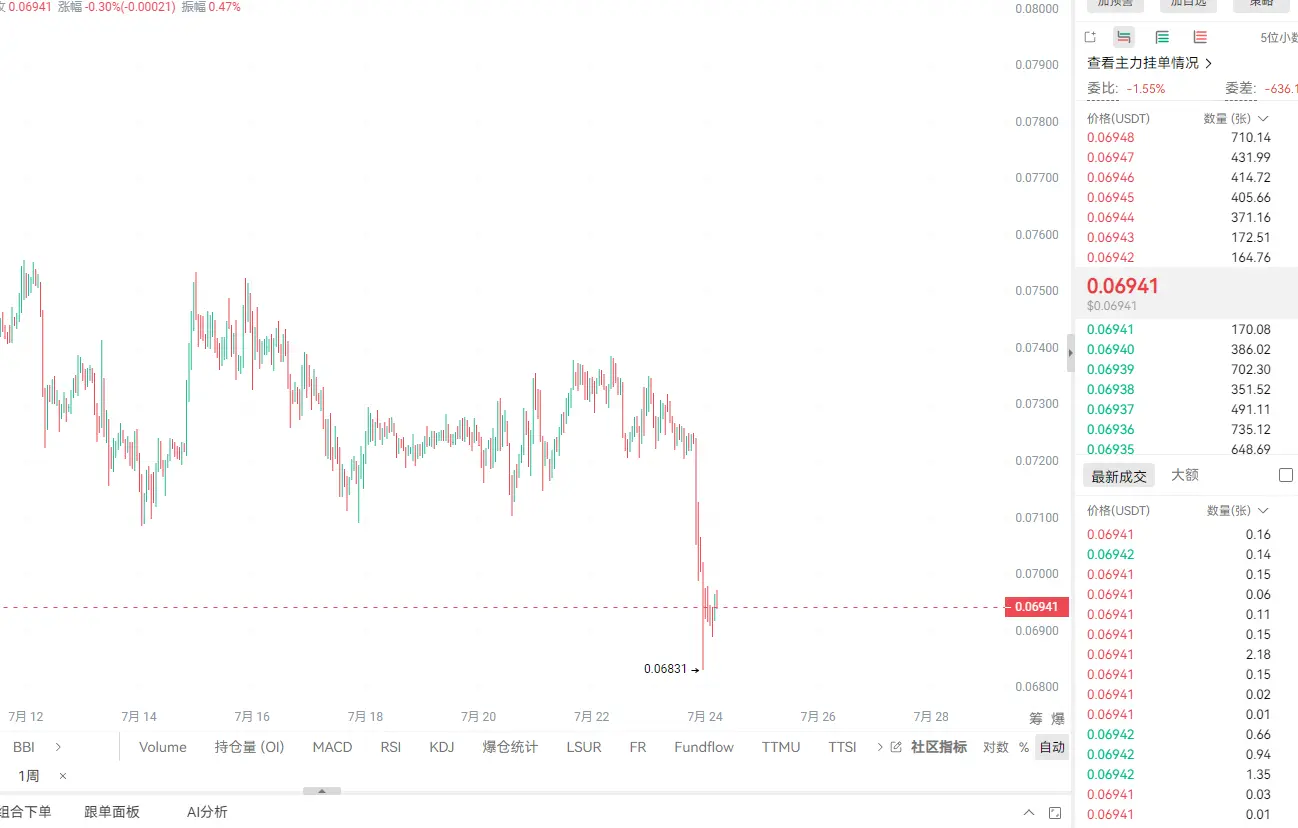
MATIC has now been upgraded to POL. The price is around 0.078 u. It is down more than 90% from its all-time high of 1.29—this is a very brutal drop.
This week the sell-off has been a bit sudden: down about 5%. If you stretch it to a month, it still looks like a small gain—up less than 3%. This suggests a rhythm where it first pumped, then got smashed back. The 24-hour movement is not big: the high is 0.0796 and the low is 0.0781, with a narrow range of oscillation.
A drop of more than 90% like this is relatively extreme among more mainstream projects, indicating that the market sentiment has n
POL-0.36%
View Original
  • Reward
  • Comment
  • Repost
  • Share
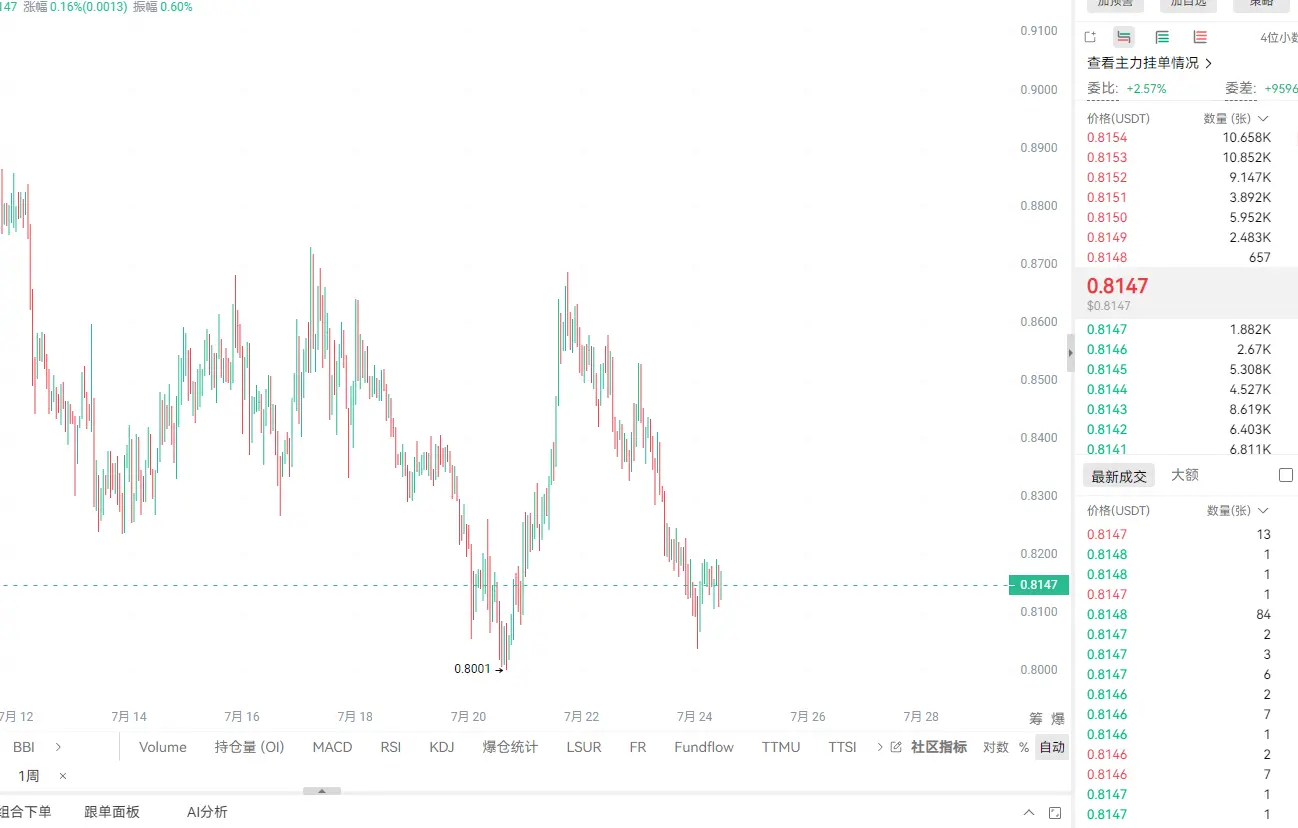
DOT is currently around 0.81u. It has fallen from its historical high of 55 to just a small fraction—down 98% and a bit more.
More importantly, this price isn’t far off its historical low either. It only just set a new low last month, and now it’s basically hovering around that level. This kind of situation isn’t common, which shows the market really has no confidence in it.
The recent trend is also steadily downward: down nearly 4% over the past week, down close to 10% over the past month, and over the last 24 hours it’s still falling—down around 3%. There are no signs of stabilizing.
The cir
DOT3.56%
View Original
post-image
  • Reward
  • Comment
  • Repost
  • Share
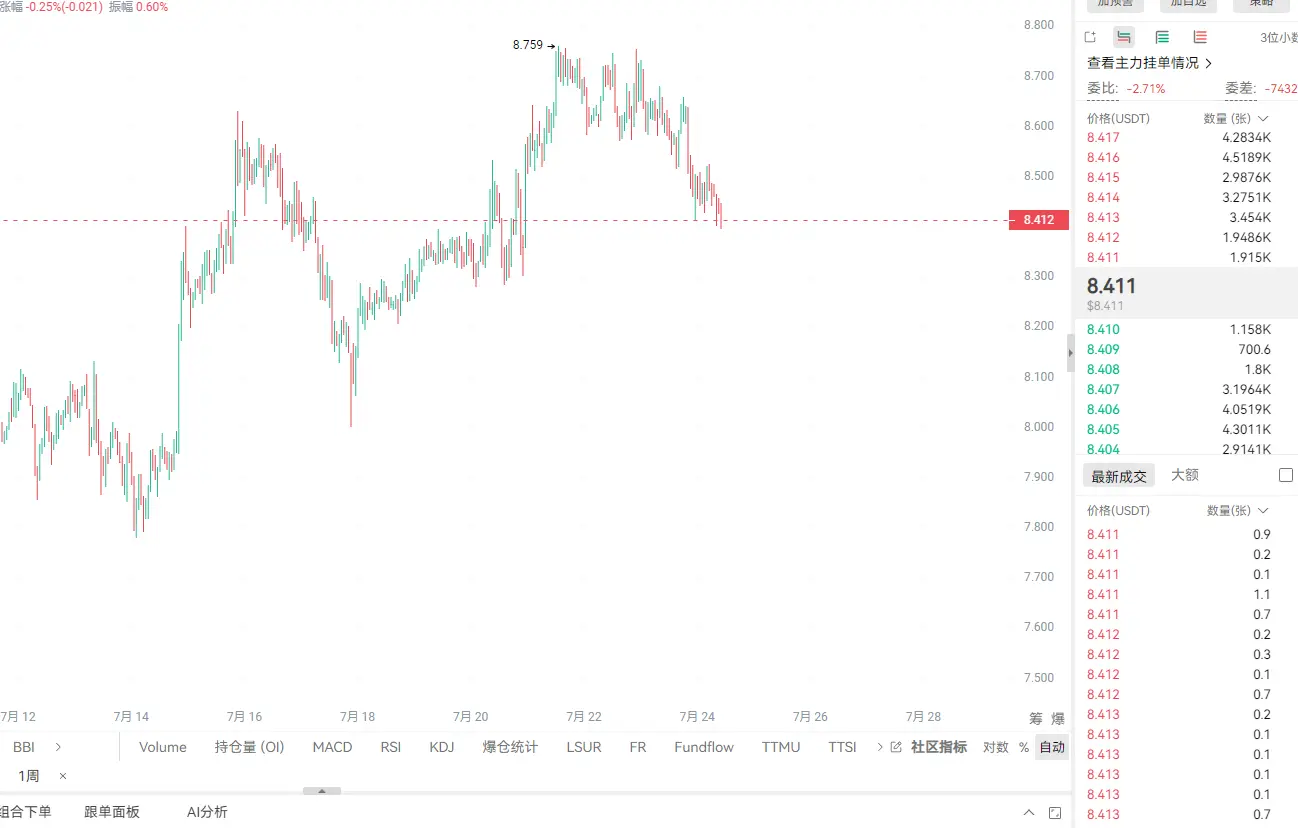
LINK is now around $8.4u, down more than 2% today. It’s one of the rare, decent pullbacks you can see in this period.
In the previous month, it rose pretty sharply, with a cumulative gain of more than 10%. A week ago it was still going up, but over these past two days it has started to retrace. Even at the 24-hour high it was still around 8.65; now it has already dropped to around 8.4, and the decline is relatively concentrated.
After a move like this—pumping hard and then suddenly dropping—it’s likely that the earlier chase funds are taking profits. After such a big rally, someone has to exit
View Original
post-image
  • Reward
  • Comment
  • Repost
  • Share
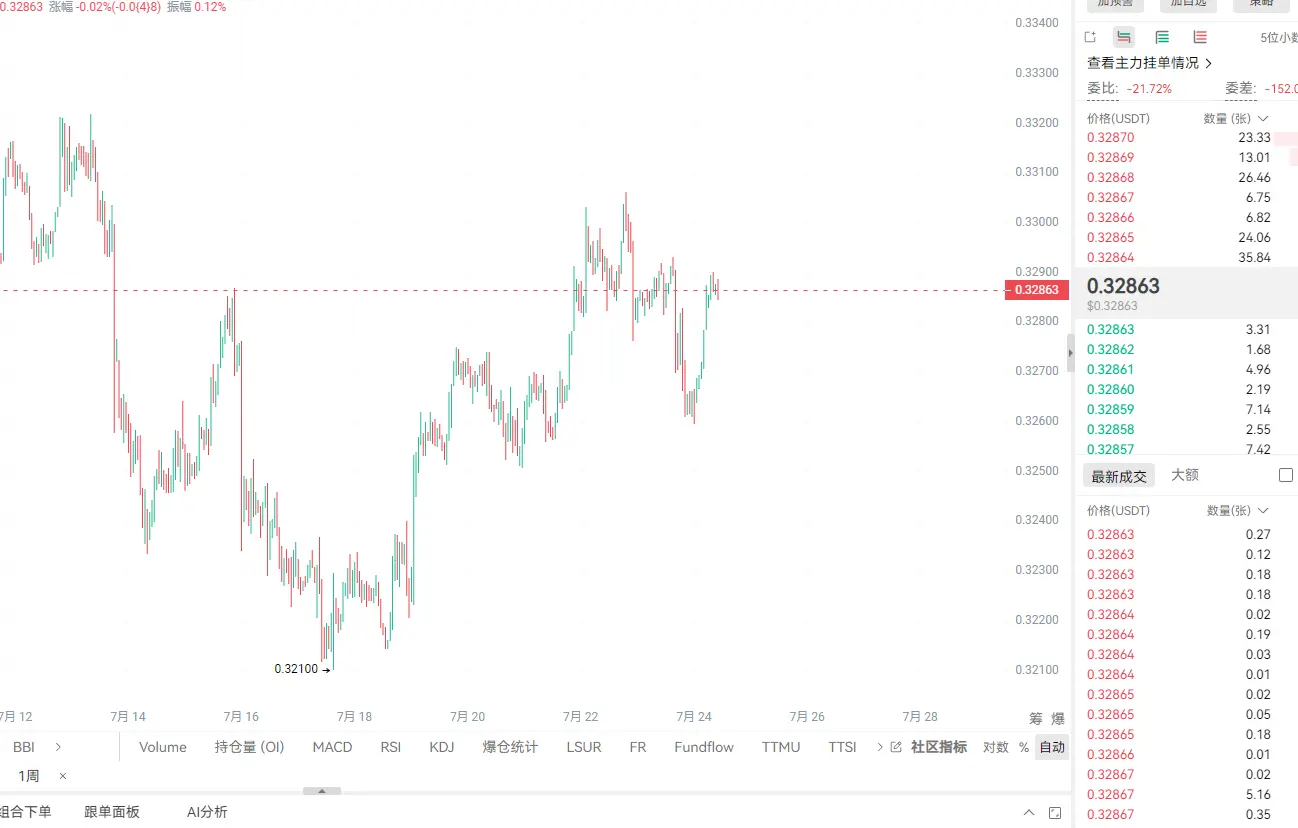
TRX is now hovering around 0.329u, with only small fluctuations—it’s been bouncing in a narrow range of 0.32u to 0.33u.
Justin Sun’s project has delivered impressive results in stablecoin settlement volume. Last year, USDT’s average daily settlement volume exceeded Ethereum to become No. 1 across the entire network. The total stablecoin supply has reached the eight-hundreds-of-billions level—over 80 billion—but the token price here has never kept pace with this business growth. As the network is being used more and more, the coin price has stalled in place—this divergence is quite obvious.
Ins
TRX-0.12%
ETH0.12%
WLFI-3.02%
View Original
post-image
  • Reward
  • Comment
  • Repost
  • Share
ADA today rose to around 0.175u. Over the past two days, it has been gradually holding steady above the short-term moving averages. It has formed a base above the June low.
Around June 30, it fell to 0.145u. This month’s worst period saw it drop by nearly 40%. During that time, large whales kept buying the dip, but on-chain usage was still trending downward—an image that looks quite divided.
On July 18, it completed a hard fork upgrade called Van Rossem, bumping the protocol version to 11. The smart contracts became faster and cheaper, and node security was also strengthened. The upgrade proce
ADA-0.59%
View Original
  • Reward
  • Comment
  • Repost
  • Share
DOGE is trading around 0.0735u today, up about two points in a day. In the past two days, the White House reached an ethical agreement in the Clarity Act. Bitcoin has surged to 66,000u, and ETH, XRP, and DOGE are rising together.
There’s an on-chain development worth mentioning: a whale recently bought 200 million DOGE through Robinhood, spending 14 million USD. The timing was right during the price consolidation period, and the market interpreted it as a signal that big players are showing confidence.
On the technical side, the market is currently forming an ascending flag pattern. If it brea
DOGE1.61%
BTC-0.22%
ETH0.12%
XRP-0.23%
LTC-0.54%
View Original
post-image
  • Reward
  • Comment
  • Repost
  • Share
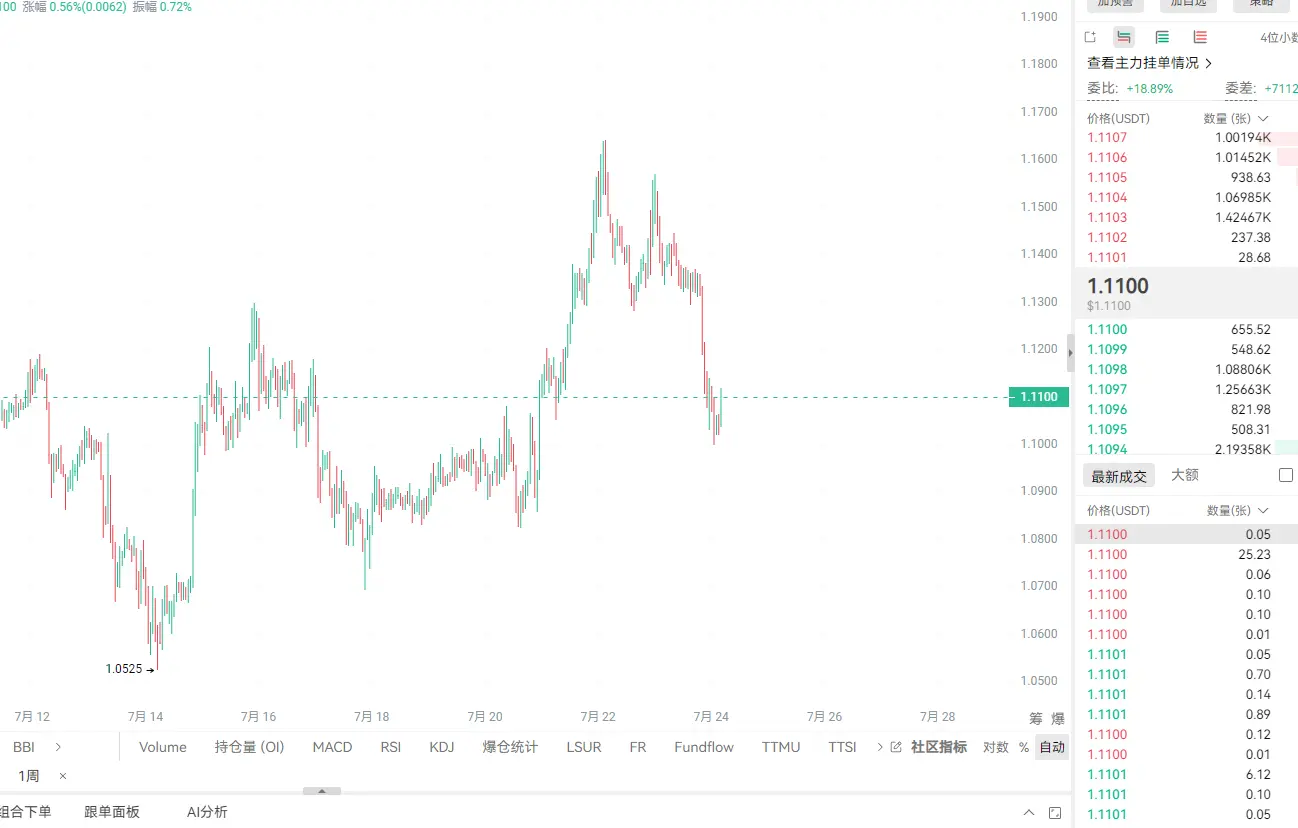
XRP is today up to around 1.14u. It’s a coin that had fallen for half a year, but in the past few days it suddenly came back to life again.
The daily chart has formed an ascending triangle. This pattern is often associated with a bullish continuation or a reversal, suggesting that buying pressure is gradually taking back the upper hand.
However, let’s pour some cold water on it: the long-term moving averages are still pressing down. The 200-day moving average is around 1.44u, and the price is still far from that level. In the bigger picture, the trend remains weak. This rebound can only be con
XRP-0.23%
View Original
post-image
  • Reward
  • Comment
  • Repost
  • Share
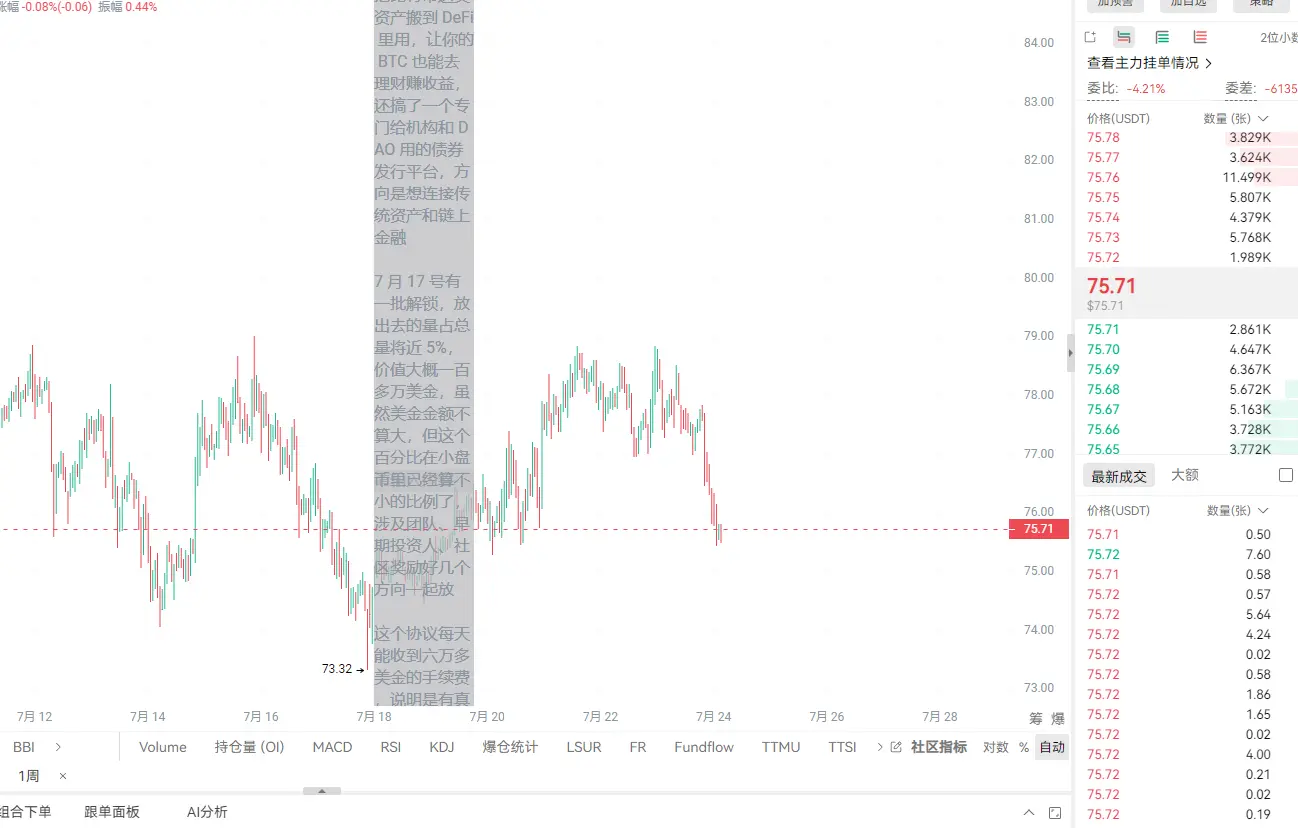
SOLV is currently around 0.0028u. The data over the past two days has been relatively scattered, so I’ll write it based on the most recent figures.
This coin is designed to move assets like Bitcoin into DeFi so that your BTC can also be invested and earn yield. It has also built a dedicated bond issuance platform for institutions and DAOs. The goal is to connect traditional assets with on-chain finance.
On July 17, a batch is set to be unlocked, and the amount being released will account for nearly 5% of the total supply, with a value of roughly over $1 million. While the dollar amount isn’t h
SOLV1.38%
BTC-0.22%
View Original
post-image
  • Reward
  • Comment
  • Repost
  • Share
BNB is trading in a range around 565 to 573 u today, with the previous close at 579 u. It pulled back earlier today.
Over the past two days, market risk appetite has been returning. BTC has risen to above 65k u, and the Nasdaq is also up, but BNB hasn’t kept up today—instead, its price action looks weak.
BNB Chain has data over the past two days: 24-hour fee revenue is $220k, and the project team’s net income is $22,200. That’s a normal level—nothing particularly special.
As for price, over the past 12 months it has fallen by nearly 18%. The 52-week high was around 1,373 u, and now it’s down b
BNB1.14%
BTC-0.22%
NAS100-1.50%
View Original
post-image
  • Reward
  • Comment
  • Repost
  • Share
ETH is up to around 1940u today, up by 76u earlier than yesterday. The market’s risk appetite has returned over the past two days.
BTC has also risen together to above 66ku. Nasdaq tech stocks have been rising these past two days too. This crypto rally is following the same rebound in risk sentiment as the traditional markets.
However, this move isn’t particularly solid yet—there are still a number of big whales that haven’t fully returned. More of it is short-term capital moving first. The second-quarter earnings reports haven’t all been released yet, and the market is still digesting the imp
ETH0.12%
BTC-0.22%
NAS100-1.50%
View Original
post-image
  • Reward
  • Comment
  • Repost
  • Share
BTC is around 65.9k u today. The daily chart and the hourly chart are telling two different stories right now.
On the daily chart, price is struggling in the 65,488 to 66,527 u range. MACD is lifting upward, which suggests momentum is building. But on the hourly chart, momentum has already started to fade—buyers still haven’t gained structural control.
The daily pivot is at 66,114 u. Above that, the Bollinger upper band at 66,263 u and the hourly 20 MA at 66,145 u are capping price. This area is a heavy, dense sell-pressure zone, and bulls haven’t managed to clear it out—for now.
First, we nee
BTC-0.22%
View Original
post-image
  • Reward
  • Comment
  • Repost
  • Share
  • Pinned